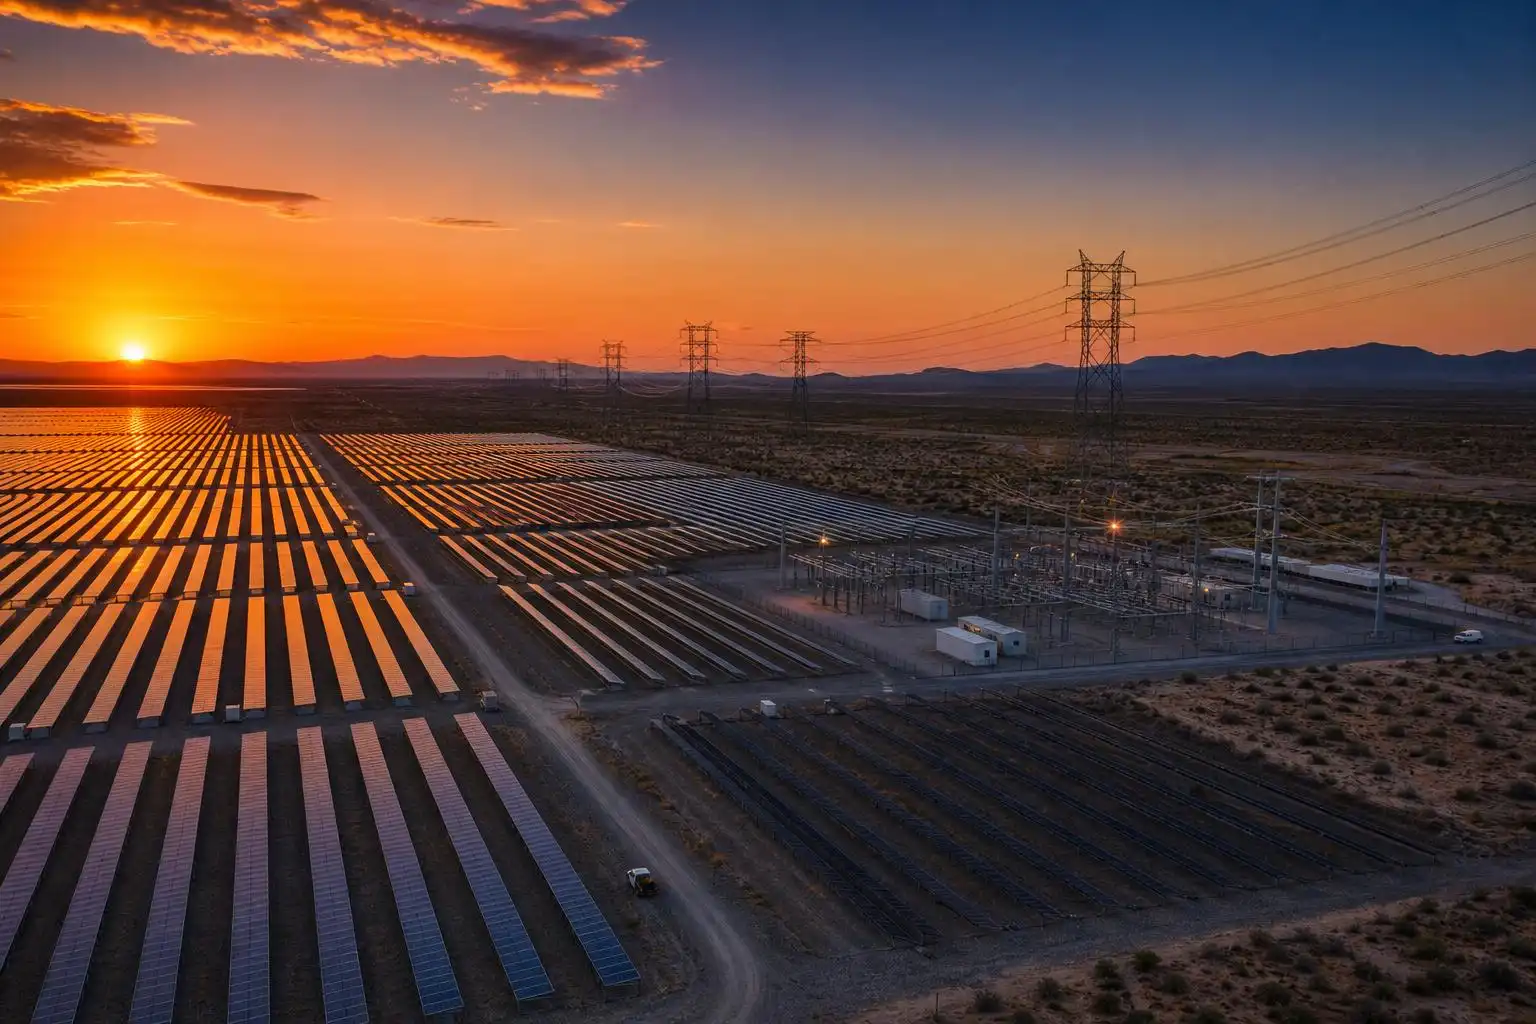

The headline from the IEA’s Electricity 2026 report sounds almost reassuring: global CO₂ emissions from electricity generation stabilised in 2025 and are forecast to plateau through 2030.[1] After years of watching that number creep upward, “flat” feels like progress. It is progress — but it is not the same thing as the sustained decline the climate math actually requires. Let me explain why the distinction matters, and what the deployment numbers underneath the headline tell us about where we genuinely are.
The Arithmetic of a Plateau
Electricity generation is the largest single source of energy-related CO₂ emissions on the planet, producing roughly 13,900 million tonnes annually.[1] Between 2022 and 2024, those emissions were growing at an average of 1.4% per year. Stabilisation in 2025 is therefore a meaningful inflection point — it means renewables and nuclear are now growing fast enough to absorb rising electricity demand without adding net carbon to the atmosphere.
But a plateau is not a peak followed by a decline. Emissions staying flat at 13,900 Mt/year through 2030 means the power sector continues to dump roughly 69 billion tonnes of CO₂ into the atmosphere over that five-year window (2026–2030). That is not a budget-compatible trajectory. For context, the IEA’s own net-zero pathway requires power sector emissions to be falling sharply by the late 2020s, not hovering.
The reason we’re plateauing rather than declining comes down to a race between two very fast-moving things: renewable deployment and electricity demand growth. Renewables and nuclear are expected to account for around half of global electricity generation by 2030, with renewable generation growing at roughly 8% per year and solar PV alone adding over 600 TWh annually.[1] That is genuinely extraordinary build-out. The problem is that electricity demand is also growing, driven by data centres, EV charging, industrial electrification, and cooling loads in a warming world. The clean generation is running to stand still on emissions, not yet pulling ahead.
Southeast Asia: Where the Gap Is Widest
If you want to see the stakes of the plateau problem in concentrated form, look at Southeast Asia. The IEA’s Southeast Asia Energy Outlook 2026 models an Announced Pledges Scenario (APS) in which electricity generation in the region rises from around 1,460 TWh in 2024 to nearly 4,600 TWh by 2050 — more than a threefold increase.[2] Under that scenario, low-emissions sources climb from roughly one-quarter of generation today to around 90% by mid-century. Solar PV alone is projected to grow from 44 TWh in 2024 to nearly 1,750 TWh by 2050, while battery storage expands from just over 1 GW today to more than 300 GW.[2]
Those are the pledges. The question, as always, is whether the infrastructure to carry that electricity actually gets built on time.
The ASEAN Grid Delay Problem
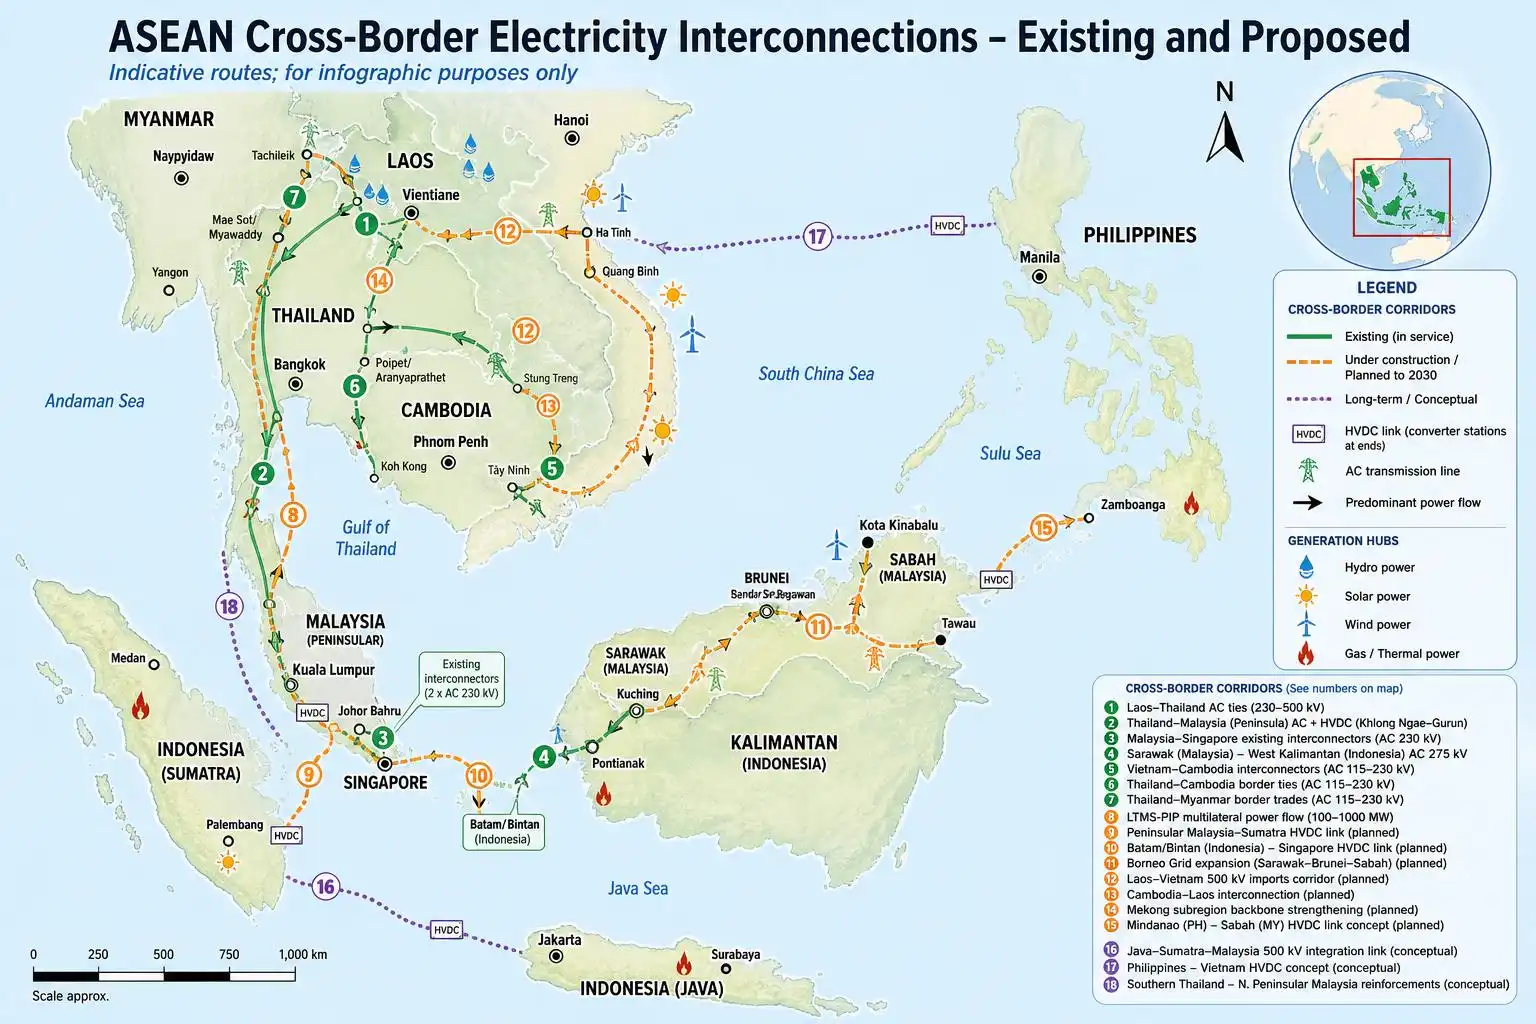
Ember’s recent analysis of the ASEAN power grid puts a precise cost on delay — and the numbers are stark.[4] The study models grid integration across ASEAN under a base case and several delay scenarios. A five-year delay in regional grid interconnection locks in over 55 billion cubic metres of additional cumulative gas consumption by 2040 — a volume that exceeds the combined 2024 gas consumption of Thailand and Singapore — and adds more than 71 million tonnes of CO₂ emissions, roughly equivalent to the Philippines’ entire power sector output in 2025.[4]
Even a single year of delay puts over 7 GW of solar capacity on hold while simultaneously requiring an additional 3.5 GW of battery storage and locking 0.3 GW of gas into Singapore’s generation mix.[4]
This is the infrastructure trap in miniature: renewables are cheap and getting cheaper, but they can only displace fossil generation if the wires exist to move the electrons from where the sun shines to where the load sits. Without cross-border transmission, each country optimises its own grid separately, and the system-level gains from regional complementarity — Vietnam’s solar peaking when Laos’s hydro is constrained, for instance — simply evaporate. The clean electrons that could have been shared instead get backed up by gas that didn’t need to run.
Battery Storage: The One Number That Is Clearly Moving in the Right Direction
There is one unambiguously positive data point in the current deployment picture: battery storage is scaling at a pace that would have seemed implausible five years ago. U.S. battery storage capacity has averaged 70% growth per year over the last three years, according to EIA data.[7] That growth is being driven substantially by the pairing of solar PV with storage — operators can charge when wholesale prices are low and discharge during peak demand, which improves project economics while also smoothing the duck curve.
The IEA’s Southeast Asia APS scenario requires battery storage to scale from 1 GW to 60 GW by 2035 — a 60-fold increase in a decade.[2] That sounds aggressive, but the U.S. trajectory suggests it is not physically impossible. The constraint in Southeast Asia, as in most emerging markets, is not technology availability — it is financing structures, permitting regimes, and the grid interconnection that storage needs to be useful at scale.
What “Plateau” Actually Tells Us About the Transition’s Pace
The IEA’s plateau forecast through 2030 is worth reading carefully for what it implies about the speed of the transition. Renewables and nuclear together reaching around half of global electricity generation is a structural milestone — it will be the first time in the modern era that low-carbon sources approach the majority of the world’s electricity mix.[1] That matters.
But the emissions plateau also tells us that the transition is currently running at roughly the pace needed to neutralise demand growth — not the pace needed to achieve absolute reductions. To get from plateau to decline, one of three things has to happen: demand growth has to slow (unlikely given electrification trends), the pace of renewable deployment has to accelerate further (possible, but requires grid investment to keep up), or some combination of the two.
The grid investment piece is the part that does not show up in renewable capacity announcements. Solar panels get manufactured and installed in months. Transmission lines take years to permit and build. Battery storage is scaling fast in markets with the right incentives. But the wires — both within countries and between them — remain the binding constraint in most of the world. The ASEAN analysis makes this concrete: delay the grid, and you don’t just delay the clean energy; you actively lock in the fossil fuel it was supposed to replace.
The Number to Watch Through 2030
If I had to pick one metric to track over the next four years to know whether the plateau becomes a peak and then a decline, it would not be solar installation rates — those are already impressive and reasonably predictable. It would be transmission and distribution capacity additions, both within major demand centres and across borders in regions like Southeast Asia, where the IEA’s APS scenario requires T&D capacity to expand more than two-and-a-half-fold by 2050.[2]
Solar deployment curves are bending the right direction. Battery costs are falling. The physics of the transition is not the problem. The problem is the permitting queues, the financing gaps, and the political economy of cross-border grid agreements — the slow, unglamorous infrastructure work that determines whether the electrons generated by all that new renewable capacity actually reach the loads that need them.
A plateau is better than a rise. But it is not a victory. It is a waypoint, and the distance to the destination is still measured in wires.
References
- Executive summary – Electricity 2026 – Analysis — https://www.iea.org/reports/electricity-2026/executive-summary
- Energy outlook to 2050 based on targets and pledges – Southeast Asia Energy Outlook 2026 — https://www.iea.org/reports/southeast-asia-energy-outlook-2026/energy-outlook-to-2050-based-on-targets-and-pledges
- The ASEAN Power Grid: Why every year of delay matters — https://ember-energy.org/latest-insights/the-asean-power-grid-why-every-year-of-delay-matters
- Battery storage capacity averaged 70% growth over the last three years – U.S. Energy Information Administration (EIA) — https://www.eia.gov/todayinenergy/detail.php?id=67925


Leave a Reply