
A reader wrote to me last month with a very specific problem. Her in-laws want to help the family buy a small place near the water in the Carolinas, something to keep for decades and pass down. She’d read enough headlines about melting ice sheets to feel queasy about signing anything. Her question wasn’t abstract: does this purchase make sense on a 30-year horizon, or is she buying a future swamp?
I get versions of this question a lot, usually reworded for a different coastline — Florida, New Jersey, the Gulf, the Pacific Northwest. The honest answer is that it depends enormously on where exactly you’re standing, and that “sea level rise” is not one number happening at one speed everywhere. Let me walk through how to actually think about it, because the framing in most news coverage makes this harder than it needs to be.
The Number in the Headline Is a Global Average, Not Your Beach
When you read that seas have risen about eight or nine inches since 1900, or that some scenario points to two feet by 2100, that’s a global mean. It’s useful for scientists tracking how much water has moved from ice sheets and glaciers into the ocean, plus how much the ocean itself has expanded as it warms. But it is almost never the number that determines whether your specific dock is underwater in 2050.
Local sea level depends on a stack of factors on top of that global signal. Land itself moves — some coastlines are sinking (subsidence) because of groundwater or oil extraction, or because they’re still settling from the last ice age; others are actually rising (parts of Alaska and Scandinavia are rebounding because the ancient ice sheets that once pressed them down have retreated). Ocean currents pile water up against some coasts more than others — the Gulf Stream’s behavior alone creates meaningful differences between, say, Miami and Charleston. And storm patterns interact with all of this, because the water that matters for your insurance claim isn’t the calm high tide, it’s the storm surge riding on top of an already-elevated baseline.
This is why Louisiana’s Gulf Coast is experiencing some of the fastest relative sea level rise in the country — over half an inch a year in spots — largely because the land is sinking from sediment compaction and oil and gas extraction, compounding whatever the ocean itself is doing. Meanwhile a rocky stretch of coast in Maine might see less relative change over the same period because the land is rising. Two houses a thousand miles apart, same global sea level trend, very different fates.
So How Do You Find Your Actual Number
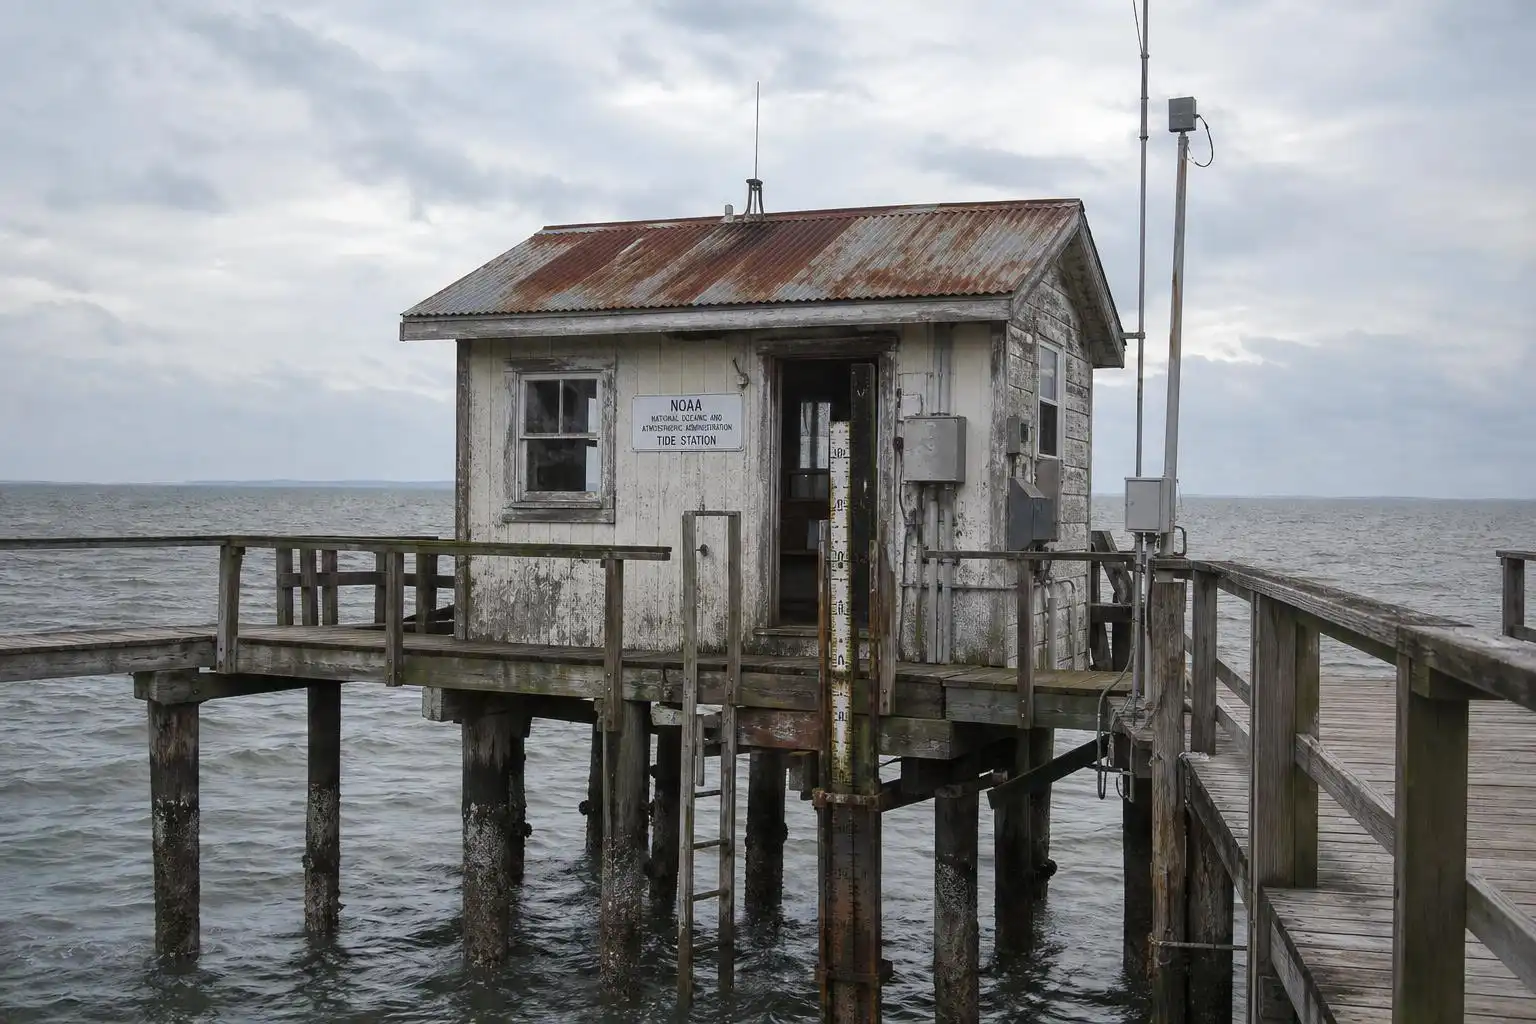
The tool I point people to is NOAA’s sea level rise viewer, which maps local flooding at set increments of sea level rise, alongside NOAA’s companion scenario and projection tools that translate those increments into likely timing for your location. It’s not perfect — projections beyond about 2050 depend heavily on how fast ice sheets in Greenland and Antarctica respond, which is genuinely one of the harder open questions in climate science — but the viewer’s maps are screening-level products built from elevation and hydrologic data layered on tide gauge records specific to your stretch of coast. That’s a categorically better answer than a global average.
For my reader’s Carolina property, I’d also tell her to look up whether the county has adopted updated FEMA flood maps recently, because flood maps get revised as data improves, and older maps sometimes badly undercount risk in fast-changing areas. A property that was comfortably outside the 100-year floodplain in 2005 may not be outside it today, and mortgage lenders and insurers are increasingly pricing that in even when local governments haven’t caught up. If insurance premiums are already climbing steeply for comparable properties nearby, that’s often a more current signal than the flood map itself, because insurers have their own risk models and they update them faster than the regulatory maps.
The 30-Year Question Is Different From the 100-Year Question
Here’s something that I think gets lost in doom-scrolling about sea level: the range of outcomes over the next three decades is genuinely narrower than the range of outcomes by 2100. Through about 2050, most credible projections for a given location cluster relatively close together, because sea level has a lot of inertia — the ocean and ice sheets don’t turn on a dime, and what’s going to happen in the next 30 years is already substantially “baked in” by past emissions and current ice sheet momentum. Climate modelers who study these projections generally agree that near-term rise is fairly predictable, even if emissions trajectories from here diverge wildly.
Beyond 2100, and even for the back half of this century, the range widens dramatically, mostly because of uncertainty about how ice sheets behave under sustained warming — whether certain glaciers in West Antarctica pass thresholds that lead to faster, harder-to-reverse retreat. That’s not a reason to panic about a 2026 home purchase; it’s a reason to distinguish between “will this place likely be fine when my kids inherit it in 30 years” (answerable with real confidence for most locations) and “will this place be fine in 2100” (much harder to say, and honestly probably not the question you need answered to make a 2026 decision, since almost nobody holds a single property, unchanged, for 75 years).
What Actually Changes the Calculation
The more useful frame for a purchase decision isn’t “will this be underwater” but “how will the cost of owning this place change.” Even properties that stay technically dry for decades can become expensive to insure, expensive to finance, and harder to resell as risk becomes more widely priced in. Nuisance flooding — the kind that closes a road for a few hours during a king tide, not the kind that destroys a house — is already increasing in frequency in many low-lying coastal towns, and it’s a leading indicator that shows up in insurance and municipal budgets well before anything looks dramatic from a satellite photo.
I’d also gently push back on the idea that there’s a single verdict — “safe” or “not safe” — waiting to be discovered. Real estate near water has always been a bet with a shifting payout, and what’s changed is that the range of future costs has widened and shifted in one direction. For some families, that’s still an acceptable trade for decades of use, especially if they go in clear-eyed about insurance costs rising and resale value being uncertain, and especially if the property isn’t the household’s only major asset. For others, particularly if this is meant to be a legacy piece of property held for a century, the math looks different, because you’re now squarely in the range where ice sheet uncertainty actually matters.
What I’d Tell My Reader
For a purchase her family plans to hold for 20 to 30 years, I told her the local sea level trend and updated flood maps were probably the two most decision-relevant pieces of information — more relevant, honestly, than any headline about 2100 scenarios. I’d want her to know the specific elevation of the lot relative to current high tide, not just relative to a floodplain designation, since a few feet of elevation can be the difference between decades of normal use and repeated flood claims. I’d also want her to talk to a local insurance agent, not just a national one, since local agents often know which streets have already seen premium spikes that haven’t hit the news yet.
None of that requires resolving the genuinely uncertain science about how fast Antarctica might destabilize by century’s end. It requires local data that already exists and is more knowable than the global headline suggests. The scary framing of sea level rise as one inexorable global number obscures the fact that your specific patch of coast has its own story, written by geology and currents as much as by carbon dioxide, and that story is more legible than the headlines let on — if you’re willing to go looking for it.


Leave a Reply