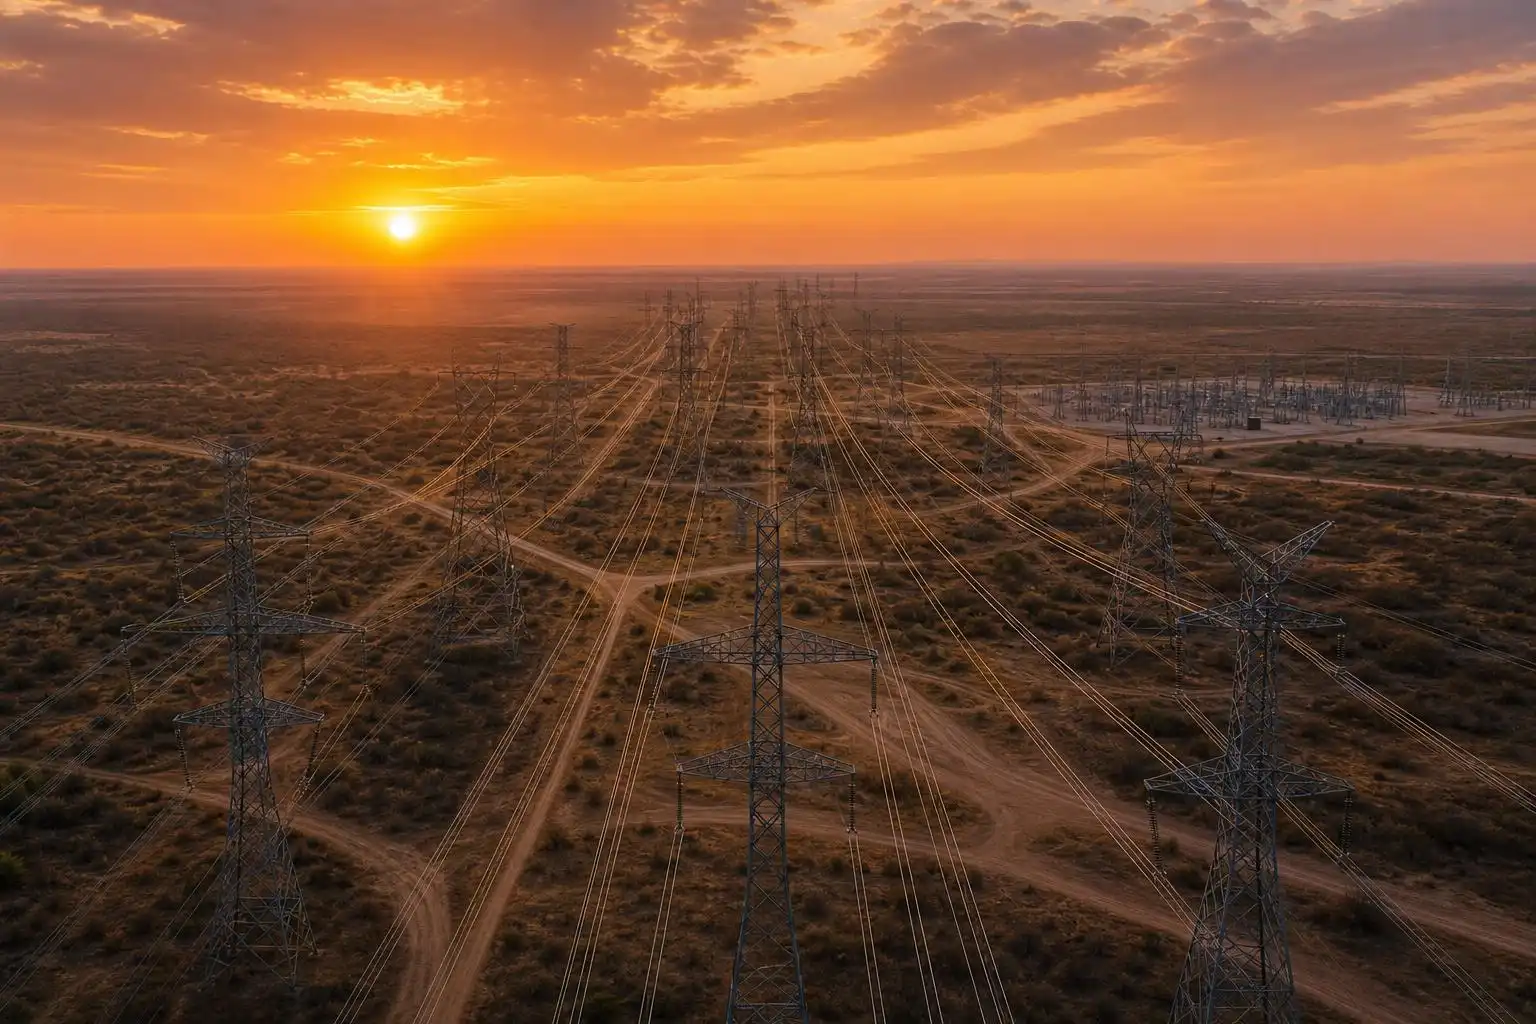

Six consecutive weeks above the previous all-time record. That is not just a heat wave. It is evidence of a demand system operating at a higher level.
From the week ending July 25 through the week ending August 29, 2026, ERCOT — the grid operator covering most of Texas — ran above the 70.0 GW weekly average record set in 2023 every single week. The peak came during the week ending August 22, when hourly load averaged 74.5 GW, a figure 6% above the 2023 record and a full 10% above the highest weekly average from summer 2025.[1] The week ending August 29 came in at 73.7 GW — still well above the old record, and not a relief.
I want to be precise about what that sequence means, because it is easy to read “record load” and reach for weather as the explanation. Weather is part of it: EIA says sustained high temperatures contributed to ERCOT’s persistently high electricity demand.[1] The same EIA item also notes that, amid record-high demand, ERCOT is auditing data center proposals to connect to the grid, following a state moratorium on new data center interconnections.
What Is Actually Driving Load Growth
The honest answer is: several things at once, and they compound.
Data centers are the most-discussed driver, and the discussion is warranted. Reuters identifies data centers as one of the fastest-growing sources of U.S. electricity demand and says major hubs in Northern Virginia are being joined by hubs in Texas, the Midwest, Atlanta, Phoenix and the West Coast.[2] Those facilities are creating new demand centers that increasingly influence utility planning and power investment decisions.
Electric vehicles add a different load profile — more predictable, more distributed, and more amenable to demand response if the utilities and aggregators do the work to capture it. Reuters groups EVs with data centers as new sources of demand that barely registered a decade ago, though the sources cited here do not quantify how much of ERCOT’s summer load increase came from EV charging, data centers, weather, or other factors.
The broader point, which Reuters mapped out in a recent analysis of American energy infrastructure, is that new demand sources like data centers and EVs are “creating new sources of demand that barely registered a decade ago,” and they are being layered onto transmission and generation networks that were not designed for them.[2] ERCOT is the most visible stress point right now, but the underlying dynamic is national.
Supply, Flexibility, and the Generation Mix
The EIA figures show record load; they do not, by themselves, establish the full generation mix used to meet that load or the operating margin ERCOT had in each hour. That distinction matters.
Texas has added substantial solar capacity over the past three years, and Reuters notes that solar power is concentrated across the Sun Belt, particularly in California, Texas and the Southwest. Wind generation, while variable, is also a major part of the regional resource map, with wind farms tracing a corridor through Texas, Oklahoma, Kansas, Iowa and neighboring Plains states. But Reuters also emphasizes that natural gas remains deeply embedded in the power sector, providing much of the dispatchable generation needed to balance electricity supply and demand.[2]
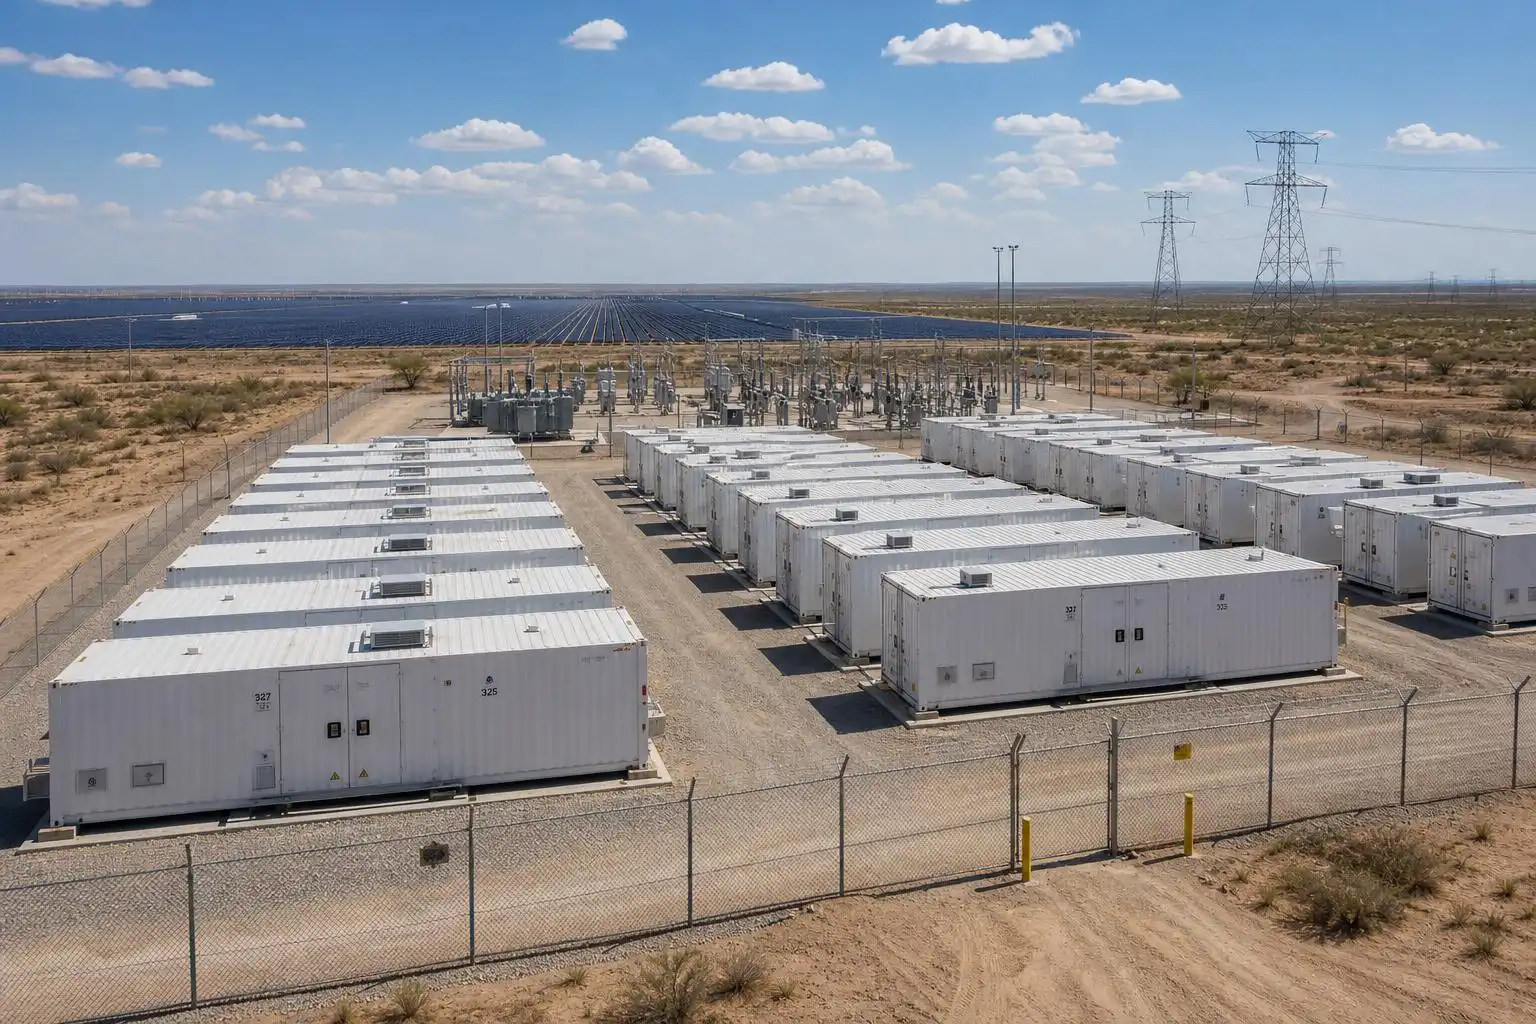
Battery storage helps at the margin. Reuters describes battery systems as increasingly appearing alongside solar projects, allowing excess daytime generation to be stored and dispatched after sunset. But the cited sources do not establish how much ERCOT battery discharge occurred during this six-week record-load stretch. The general limitation remains: short-duration batteries can shave peaks and shift energy within a day, but they are not a direct substitute for dispatchable generation over a multi-week load plateau.
The result is that ERCOT’s record-load summer raises the question of which resources are covering the residual demand after variable generation and storage. If that residual is met by unabated natural gas, emissions implications follow directly; the data cited here do not by themselves establish ERCOT’s emissions outcome for the summer.
The Demand Forecast Problem
Here is the number that should be making grid planners uncomfortable: the 2023 record stood for three years and was then exceeded not once but six weeks running. ERCOT’s long-range load forecasts have already been under pressure from data center interconnection requests, and EIA notes that ERCOT is auditing data center proposals to connect to the grid. Forecasting demand growth in an environment where large new loads can arrive quickly is genuinely difficult, and the consequences of underforecasting are asymmetric — you end up short on generation, transmission, or both.
This is not a problem unique to Texas. The Reuters infrastructure mapping project makes the structural point clearly: America’s energy system is “not a single energy system, but a collection of overlapping geographies” with transmission bottlenecks, localized reliability concerns, and generation fleets that were sited for a different demand landscape.[2] Wind is concentrated in the Plains, hydro is locked to geography, nuclear is clustered near legacy demand centers, and gas threads through everything. Demand from data centers and EVs is now growing into a system where only a small share of transmission consists of ultra-high-voltage lines capable of moving large amounts of electricity across long distances.
What a Sustained Record Load Summer Tells Us About the Energy Transition
I have written before about the difference between a plateau in power sector emissions and an actual decline. ERCOT’s summer is a concrete illustration of the planning problem. You can add gigawatts of solar and batteries and still struggle to reduce emissions if load grows faster than clean generation. The math is not complicated; it just requires being honest about the direction of the residuals.
The energy transition in the United States is real. Renewable deployment is real. Battery storage growth is real. But the demand side of the equation is accelerating in ways that the supply-side build-out has not yet matched everywhere. Reuters describes the current U.S. power system as one where new technologies are spreading rapidly while natural gas remains deeply embedded as a dispatchable resource, and where data centers and EVs are creating new demand that barely registered a decade ago.[2]
None of the obvious solutions are fast. Transmission expansion, new firm low-carbon generation, longer-duration storage, and demand response at scale all require planning, contracts, infrastructure, and customer participation.
In the meantime, the record that ERCOT set in the week ending August 22, 2026 — 74.5 GW of average hourly load — is probably not a ceiling. It is more likely a waypoint. The question grid operators, regulators, and generation developers need to be asking is not “how do we handle this summer?” but “what does the 2028 or 2030 peak look like, and what are we actually building to meet it?”
The answer to that question will determine whether ERCOT’s emissions profile bends down or continues to track sideways or up, regardless of how many solar panels get installed between now and then.
References
- Weekly average load in ERCOT continues near record high — U.S. Energy Information Administration — https://www.eia.gov/todayinenergy/detail.php?id=68084
- Mapping America’s mammoth power machine — Reuters — https://www.reuters.com/commentary/reuters-open-interest/mapping-americas-mammoth-power-machine-2026-08-10


Leave a Reply