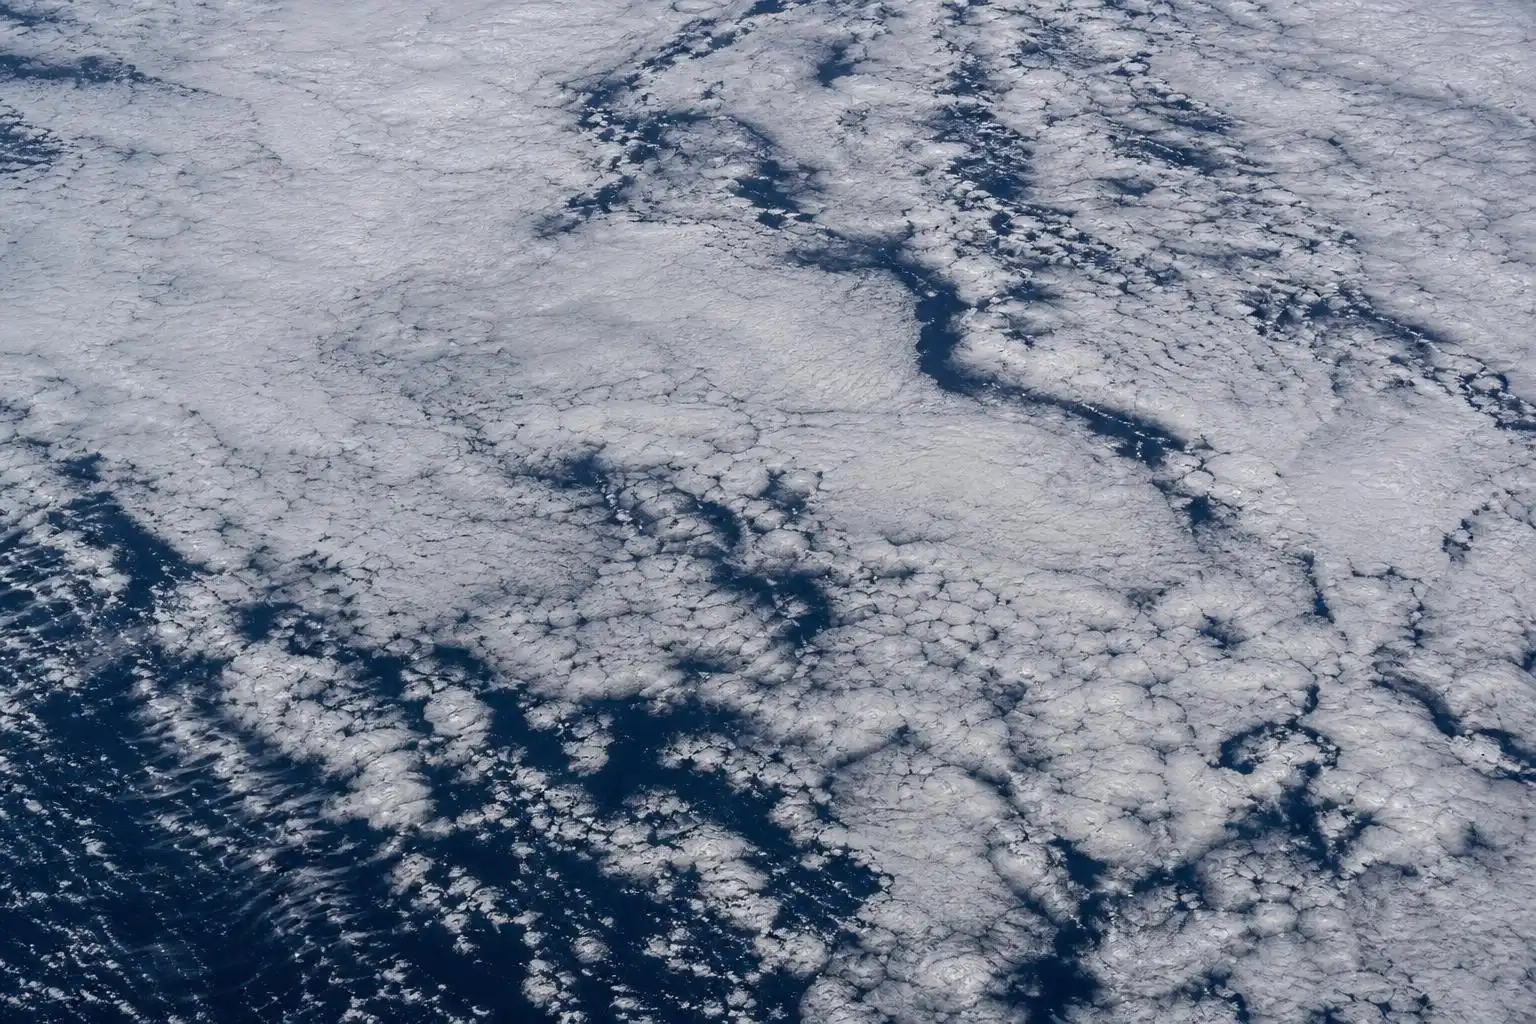

The global temperature jump in 2023 was large enough to leave a question even after accounting for the developing El Niño and the continuing rise in greenhouse gases: why did the planet absorb so much extra sunlight? Satellite measurements point to an unusually dark Earth, meaning less sunlight reflected back to space. Over some ocean regions, low clouds were unusually scarce. The tempting conclusion is that losing those clouds caused the heat spike.
I think that conclusion moves faster than the evidence. The loss of reflected sunlight helped warm the planet; that is a statement about the energy entering the climate system. But a warm ocean can also change the clouds above it. To establish that cloud loss initiated a substantial part of the 2023 spike, rather than amplified or followed it, we need to know what made the clouds disappear.
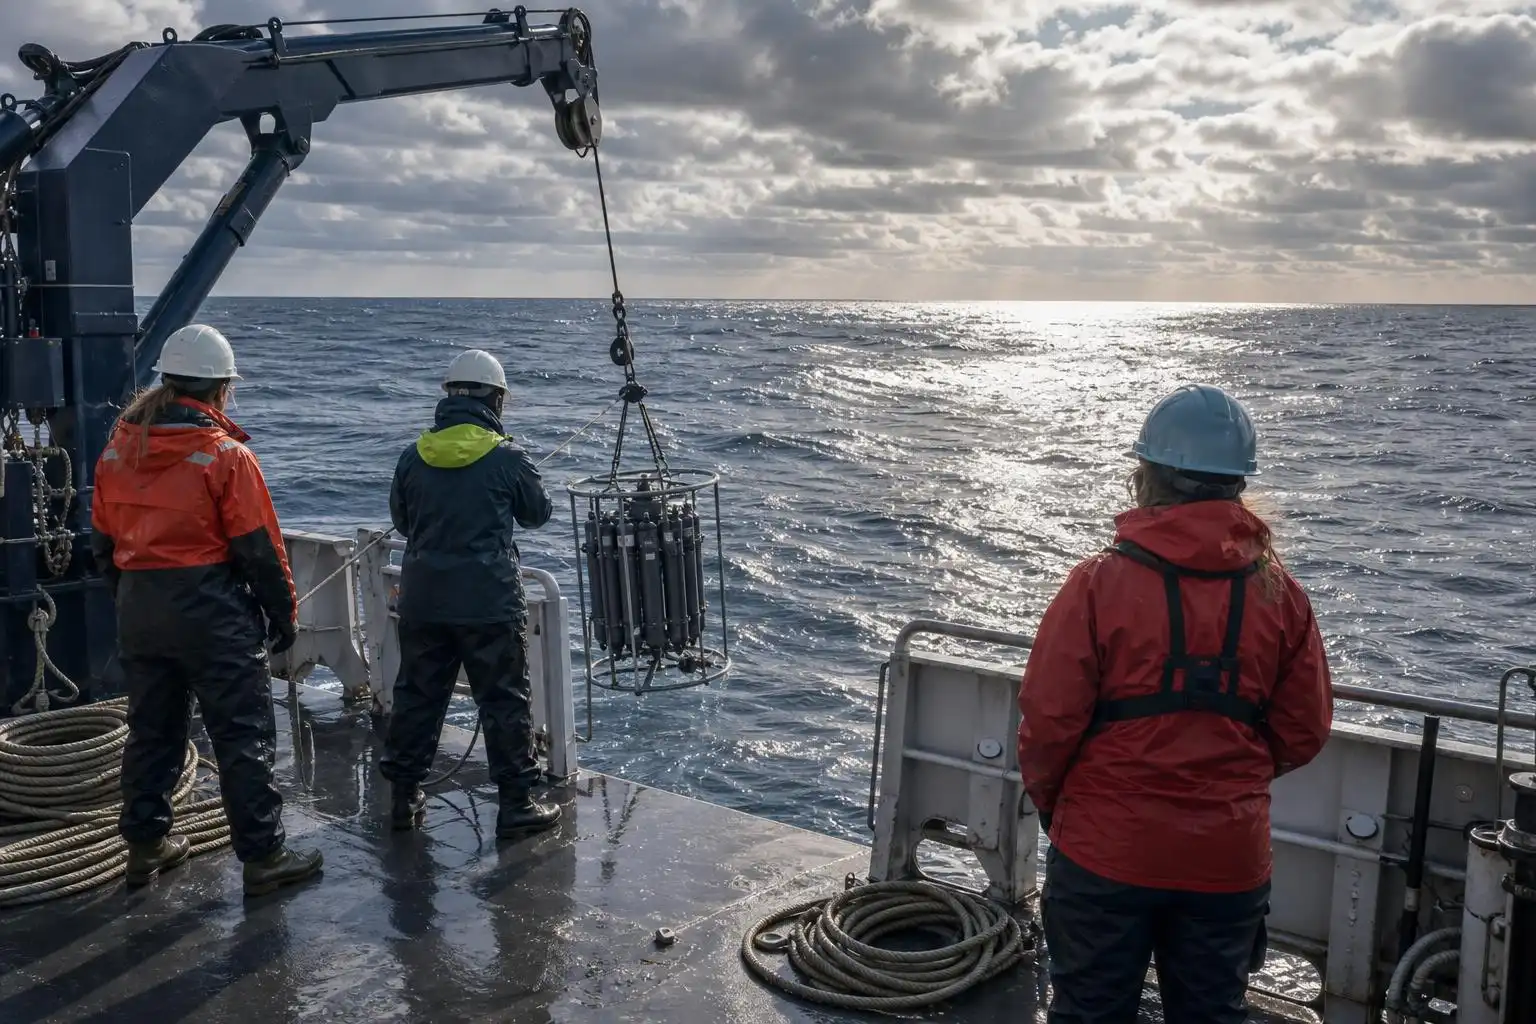
The satellite record establishes an energy gain, not its original cause
In their 2024 Science paper, Helge F. Goessling, Thomas Rackow and Thomas Jung examined the exceptional warmth of 2023 alongside measurements of planetary albedo—the fraction of incoming sunlight Earth reflects. They found a record-low albedo in the modern satellite record and identified declining low-cloud cover, particularly over parts of the oceans, as an important contributor. Their question was well chosen: estimates based on familiar drivers, including El Niño, left an unusually large temperature jump to explain.
NASA’s CERES instruments provide the crucial measurement. They observe radiation entering and leaving the top of the atmosphere, so a decline in reflected shortwave radiation is not merely a cloud photograph interpreted as an energy budget. The planet really did retain more solar energy. That makes the albedo finding harder to dismiss than an argument based only on surface temperature maps or a single ocean basin.
But CERES cannot, by itself, assign the first move. Suppose reduced aerosol pollution makes marine clouds brighter less often, or less extensive. More sunlight reaches the ocean, which warms. Now suppose instead that ocean circulation brings warmer water to the surface, changing atmospheric stability and reducing low-cloud cover. The reduction in clouds then admits still more sunlight. In both cases, CERES records a real solar-energy gain. Only the causal chain differs.
That difference matters for projection. A one-time aerosol change, a fluctuation in ocean circulation and a cloud response that grows as the planet warms have different implications for the next decade. Calling all three “cloud-driven warming” conceals the distinction we most need to resolve. My position is that the 2023 observations establish an unusually strong cloud-associated shortwave anomaly, but do not yet justify treating it as evidence that a new, persistent cloud feedback has emerged.
Aerosol cuts are a serious candidate, but shipping cannot carry the whole explanation
The strongest alternative to my caution is straightforward: humans changed the atmosphere first. Sulfur dioxide emissions produce particles that scatter sunlight and can increase the reflectivity of low marine clouds. Reducing those emissions removes some cooling. In 2020, International Maritime Organization fuel rules sharply lowered the permitted sulfur content of most ship fuel. The change was large, geographically concentrated and directly relevant to ocean clouds.
Tianle Yuan and colleagues argued in a 2024 Communications Earth & Environment study that the shipping rules produced a meaningful positive radiative forcing as ship-related aerosol effects diminished. Their result deserves attention. A forcing estimate of roughly two-tenths of a watt per square metre globally is not trivial, and the affected routes cross regions where clouds strongly influence the solar budget. It would be peculiar to assume that cleaner ship exhaust had no warming effect.
Yet the rules took effect three years before the temperature spike. A gradual climate response can bridge that gap, but timing alone cannot identify the size of the contribution in 2023. Nor should a modeled forcing estimate be read as a measured global temperature increment for that particular year. Translating forcing into temperature requires assumptions about ocean heat uptake and the pattern of the forcing. Those assumptions are especially consequential over shipping corridors.
There is also a geographical test. If shipping sulfur cuts were the dominant cause of the 2023 albedo anomaly, the strongest cloud and radiation changes should line up persuasively with shipping exposure after allowing for winds and ocean conditions. Evidence for an effect along routes does not automatically explain cloud changes across less directly affected waters. Other sources of aerosol pollution have changed too, but they require their own emissions records and regional tests; they cannot be added as an unspecified remainder.
James Hansen and coauthors made a broader aerosol argument in their 2023 paper Global Warming in the Pipeline, proposing that declining aerosol cooling contributes substantially to accelerated warming. It is an argument worth testing, not a license to attribute every recent shortwave anomaly to pollution controls. The strongest version would predict where cleaner air should alter clouds, how much reflected sunlight should change there, and when the change should appear. Without those constraints, an aerosol explanation risks becoming capable of fitting almost any warm year after the fact.
The ocean can both produce the cloud anomaly and be warmed by it
My principal reason for resisting a single-cause story is that marine low clouds sit inside a coupled system. Changes in sea-surface temperature, winds, air flowing over the ocean and atmospheric stability can alter cloud cover. Once cloud cover changes, sunlight reaching the surface changes too. The feedback can make an initial disturbance look much larger in the radiation record without revealing what started it.
Consider the North Atlantic, where exceptionally warm sea-surface temperatures and reduced cloudiness attracted attention in 2023. An ocean that has already warmed through earlier heat uptake or circulation changes may help suppress clouds under some conditions. Fewer clouds then permit additional solar heating. A satellite will faithfully measure that added energy, while a surface thermometer will faithfully measure the warmth. Neither instrument, considered alone, tells us how much of the initial Atlantic anomaly came from below the atmosphere.
This is not an argument that clouds are irrelevant. It is the opposite: their response may amplify an ocean fluctuation enough to matter globally. But amplification is not the same claim as an externally imposed forcing, and it is not necessarily a sign of a stronger long-term global cloud feedback. A response to a particular pattern of ocean temperatures can fade when that pattern changes. A feedback tied consistently to greenhouse-driven warming would have more persistent consequences.
El Niño adds another complication. It redistributes heat and reorganizes atmospheric circulation, affecting clouds well beyond the tropical Pacific. The 2023 event developed as global temperatures surged, while its influence extended into 2024. Simply subtracting an estimated “El Niño contribution” from global temperature does not remove every circulation-related cloud change. The residual is not a clean experiment in which aerosols and clouds are the only remaining actors.
The point is not that any one explanation must win everywhere. A regional aerosol forcing could coincide with ocean-driven cloud changes elsewhere, while greenhouse warming raises the baseline against which both operate. That mixed explanation is less satisfying than a single culprit, but it makes sharper predictions. It asks whether the cloud change follows emissions, precedes local ocean warming, or arrives with a shift in circulation in each region. Those are questions observations can answer.
A convincing attribution must show which change came first
The best test would combine several kinds of evidence rather than fit the global temperature curve alone. We need regional time series of reflected sunlight, cloud height and cover, aerosol conditions, sea-surface temperature and ocean heat content. Changes along shipping routes can be compared with suitably matched nearby areas, while checking whether winds and ocean conditions changed at the same time. A credible attribution should survive reasonable choices about those comparison areas and about the period used as its baseline.
Cloud measurements need particular care. A lower amount of reflected sunlight does not uniquely mean fewer clouds: clouds can also become thinner or less reflective, and changes in the underlying surface matter. CERES measures the radiation; instruments such as MODIS and VIIRS add information about cloud properties. ESA and JAXA’s EarthCARE mission, launched in 2024, offers active radar and lidar observations that can help separate cloud structure from a simple change in brightness. No single instrument provides a complete causal record.
Models have a role, provided we ask them a discriminating question. Atmospheric model experiments can impose observed ocean temperatures while holding aerosol emissions fixed, then change aerosol emissions while controlling the ocean boundary conditions. Coupled-model experiments can test how the ocean subsequently responds. Agreement with the observed global warmth is not enough; the experiments should reproduce the regional timing of clouds and shortwave radiation as well. Otherwise, different errors can cancel in the global average.
The strongest counterargument to my view is that demanding a perfectly separated cause may set an impossible standard. If aerosol cuts initiate cloud loss, and the resulting ocean warming causes further cloud loss, the two contributions rapidly become entangled. That is fair. We do not need a laboratory-grade separation before saying that declining aerosol cooling probably contributed. We do need one before assigning it a confident share of the exceptional 2023 temperature jump or claiming that the event demonstrates an enduring acceleration in cloud feedback.
What would change my mind? I would accept a large, initiating aerosol contribution if independently constrained emissions and aerosol observations predicted the magnitude, location and onset of the shortwave changes, and if experiments with realistic ocean variability could not reproduce them without that forcing. I would take the persistent-feedback interpretation much more seriously if comparable low-cloud and albedo anomalies continued across different ocean-temperature patterns, rather than tracking the exceptional pattern of 2023.
For now, the careful statement is also the consequential one. Earth absorbed unusually much sunlight, and changes in low clouds were central to that observation. Some of that change may reflect cleaner air; some may be a response to the ocean and circulation. The 2023 spike shows how strongly those mechanisms can interact. It has not yet told us which one led, or whether their alignment will last.


Leave a Reply