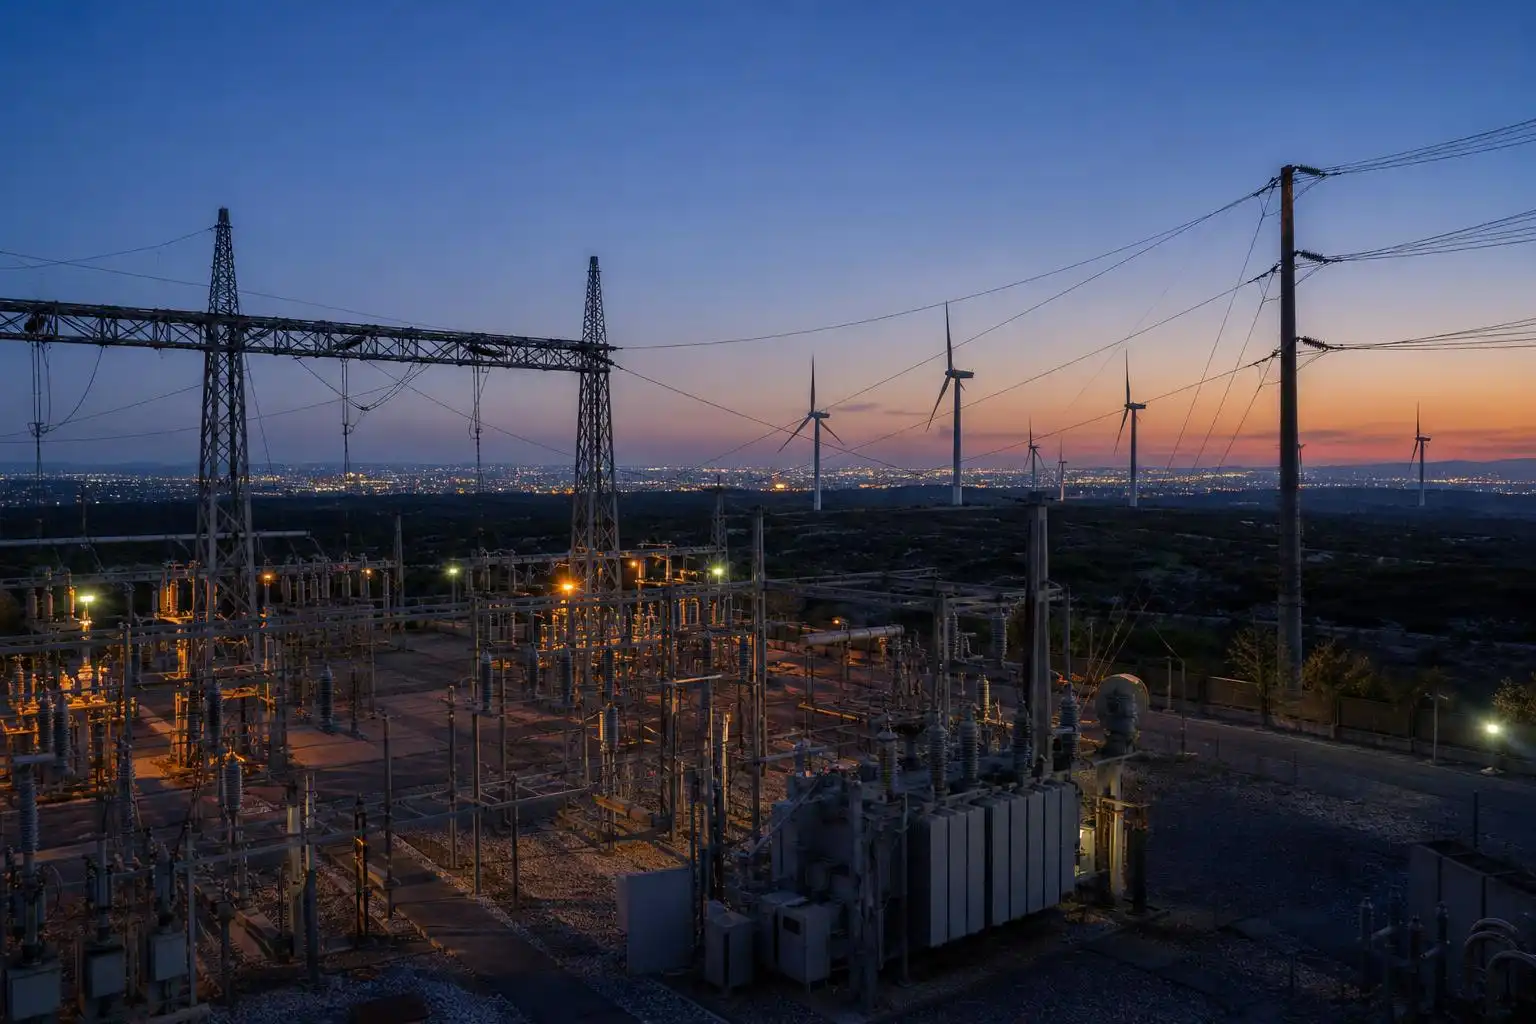

Electrification is changing what an energy transition has to deliver. Adding wind and solar remains essential, but it is no longer enough to count new generating capacity and declare progress. As vehicles, buildings and industry use more electricity, the test is whether clean power reaches them when they need it—and whether fossil-fuel use actually falls.
Ember’s recent The Age of Power frames this as a simultaneous build-out of supply, connections and demand. Its examples span solar and wind deployment, battery storage, transmission, electric vehicles, heat pumps and digital controls.[1] That is a useful map of the work. It is not, by itself, a measure of completed emissions cuts.
Why electrification can save more energy than it consumes
Electricity demand can rise while total energy use falls. A combustion power plant discards much of its fuel’s energy as heat: the International Energy Agency puts typical losses in fossil-fuel electricity generation at roughly 50–65%. There are further losses when final energy is turned into useful heat or motion.[2] Replacing a fuel-burning device with an efficient electric one can therefore change more than the fuel source; it can reduce the energy needed to provide the same service.
That efficiency advantage does not make electricity carbon-free. Its emissions depend on the generation serving the additional load and on how the power system changes over time. The IEA finds that electrification lowers total energy-sector CO₂ emissions in every case it analyzes, but its larger gains require a substantial expansion of low-emissions generation. In its high-electrification scenario, paired with an accelerated clean-power transition, end-use emissions fall 40% by 2035 and total energy-sector emissions fall by more than half relative to 2025.[2] Those are conditional scenario results, not emissions reductions already recorded.
A megawatt of capacity is not a megawatt-hour delivered
Deployment announcements often lead with gigawatts. Capacity tells us how much equipment can produce at a given moment, not how much electricity it generated across a year or whether that output coincided with demand. Ember’s framework rightly puts batteries, transmission and flexible demand alongside wind and solar rather than treating them as afterthoughts.[1]
Each solves a different problem. A battery can shift electricity between hours, but it cannot create energy during a prolonged shortage. A transmission line can connect surplus generation to demand elsewhere, but only once it is built and available. Forecasting and demand controls can make variable supply easier to manage; they do not substitute for enough clean generation. Counting all these assets in the same headline total would conceal more than it reveals.
Look at operation, not just construction
The U.S. Energy Information Administration’s regional grid monitor offers a way to inspect the operating generation mix, including a Texas-region view.[3] It is a useful check on claims about what is powering the grid at a particular time. It is not an annual emissions inventory: a day’s generation mix cannot establish a year’s carbon trend, and electricity crossing a regional boundary complicates a simple reading of local supply.
For a fairer assessment of progress, I would keep three measures separate:
- Built: generating, storage and transmission capacity that has entered service—not merely been announced.
- Operated: electricity generated, demand served and flexibility used during the hours that matter.
- Emitted: fuel burned and resulting emissions across a consistent reporting period.
EIA makes plant, generation, demand and emissions information available through its electricity and environment data products.[6] The point is not to find one perfect number. It is to avoid using a construction statistic to answer an operational question, or an operational snapshot to answer an emissions question.
China’s plans show the scope—and limits—of coordination
China’s climate and energy planning offers another view of the challenge. Carbon Brief’s tracker of its 15th five-year plans records proposals to integrate computing, storage, networks, power and carbon information, and to monitor energy efficiency and green-electricity use in computing. It also lists directions on clean energy and power-system safety.[5]
Those directions recognize that an electrified economy needs coordination between demand and the grid. But a plan is evidence of intent, not proof of execution. The questions to revisit as implementation proceeds are whether new connections and clean generation keep pace with electricity use, whether flexible equipment operates as intended, and whether measured emissions decline.
The next milestone is a sustained displacement
The transition’s strongest claim is not that more devices can run on electricity; they plainly can. It is that an increasingly clean power system can serve them reliably while displacing fossil fuels. The IEA’s scenarios show the scale of the potential and the clean-generation requirement attached to it.[2]
That leaves a practical standard for each quarterly update: report what entered service, what the grid delivered, and what happened to emissions. If all three move together, “the age of power” becomes more than a compelling description of the build-out. It becomes a measurable account of the transition.
References
- The Age of Power — Ember — https://ember-energy.org/app/uploads/2026/09/SLIDEDECK-The-Age-of-Power.pdf
- Electrification — International Energy Agency — https://www.iea.org/reports/electrification
- Real-time Operating Grid: Texas Regional Generation Mix — U.S. Energy Information Administration — https://www.eia.gov/electricity/gridmonitor/dashboard/daily_generation_mix/regional/REG-TEX
- What China’s Five-Year Plans Say About Climate and Energy — Carbon Brief — https://interactive.carbonbrief.org/china-plan-tracker/index.html
- U.S. Energy Information Administration — https://www.eia.gov


Leave a Reply