
Three data points landed in the last few weeks that, taken together, paint a clearer picture of where the energy transition is actually stuck — and where it is genuinely accelerating. None of them are particularly comforting in isolation. Together, they outline the shape of the problem with unusual precision.
1. Battery Storage Is Growing Fast. The Grid Still Can’t Keep Up.
The U.S. Energy Information Administration recently confirmed that battery storage capacity has averaged 70% annual growth over the last three years.[2] That is an extraordinary deployment rate — the kind of curve that, if sustained, tends to reshape markets. Utility-scale solar-plus-storage configurations are now a standard project type, not an experiment, and operators are increasingly using them to arbitrage wholesale electricity prices: charge when prices are low, discharge when prices are high.
But here is the uncomfortable arithmetic. Even at 70% annual growth, storage is starting from a small base. The grid integration problem it is meant to solve — absorbing variable renewable generation and firming supply during peak demand — is itself growing faster than the storage fleet in many regions. Which brings us to Texas.
2. ERCOT Just Set a New All-Time Peak Demand Record
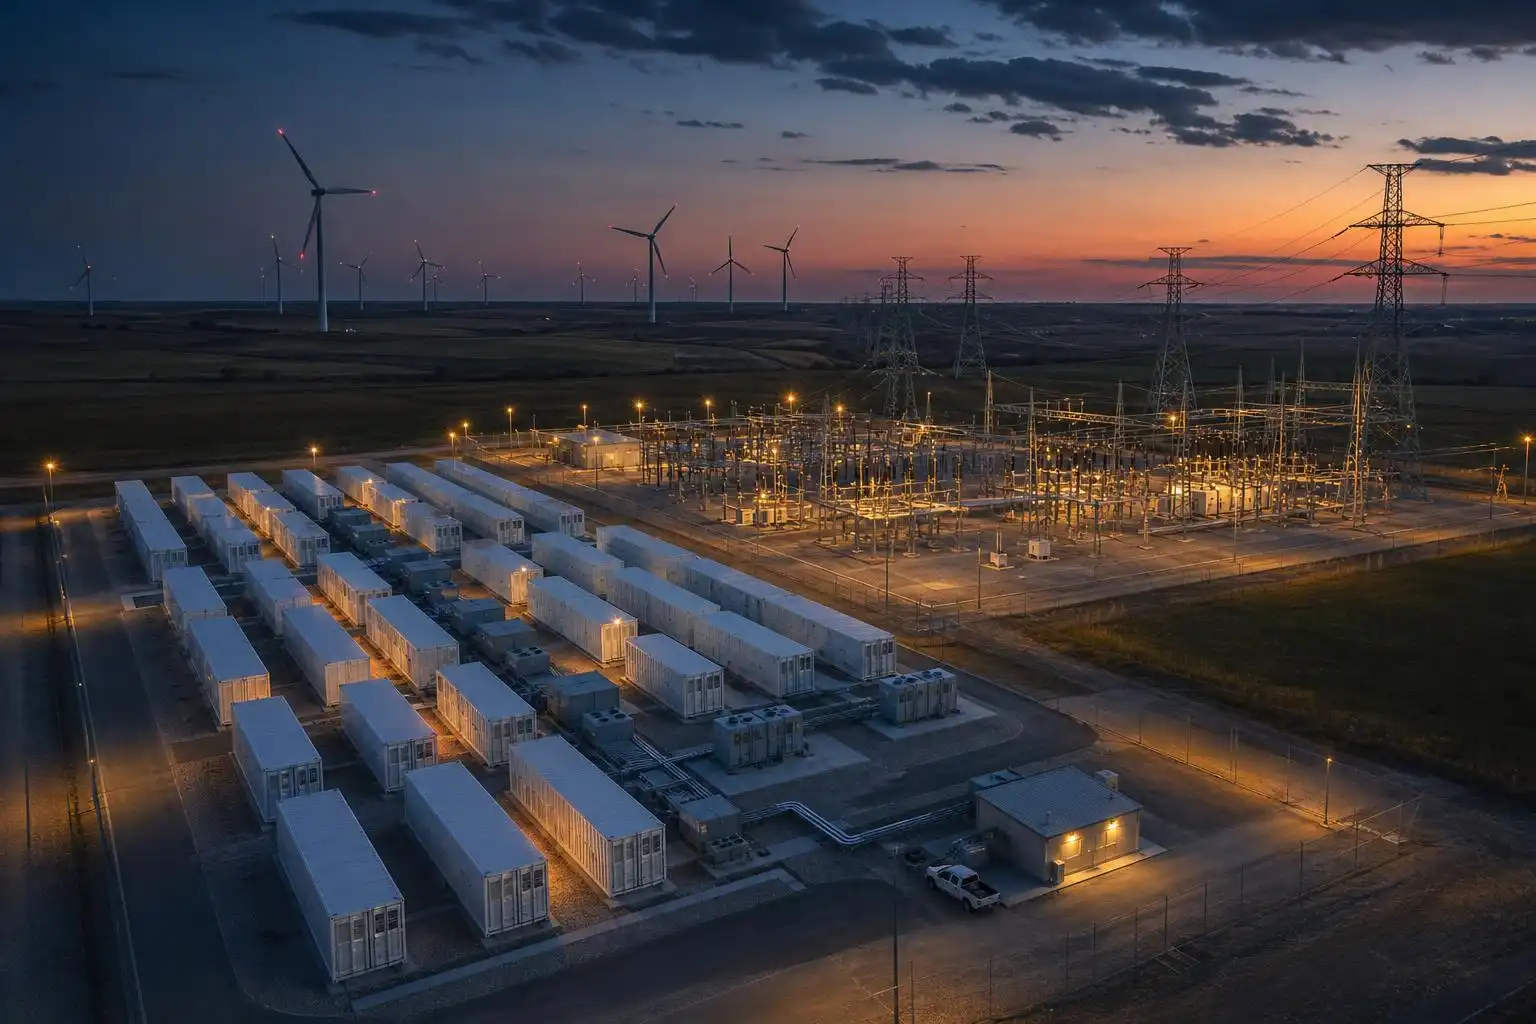
On July 22, ERCOT’s hourly peak load exceeded 91 GW, setting a new record for the Texas grid.[3] That number deserves some context. ERCOT is an isolated grid — it has minimal interconnections with neighboring systems, which means it must balance supply and demand almost entirely within its own footprint. Peak demand events like this one stress every resource simultaneously: generation, transmission, and storage.
Texas has added substantial wind and solar capacity in recent years, and battery storage deployments in ERCOT have been among the fastest in the country. But a 91 GW peak is a reminder that electrification — of transportation, of buildings, of industrial processes — is not a future scenario. It is already showing up in the load data, right now, in summer heat. The grid infrastructure question is not hypothetical. It is the operational reality that system operators manage every July afternoon.
The storage growth numbers are real and meaningful. So is the 91 GW peak. Both can be true at once, and the gap between them is where the transition lives.
3. Europe’s Hydro Corridor: 25 GW Without New Wires
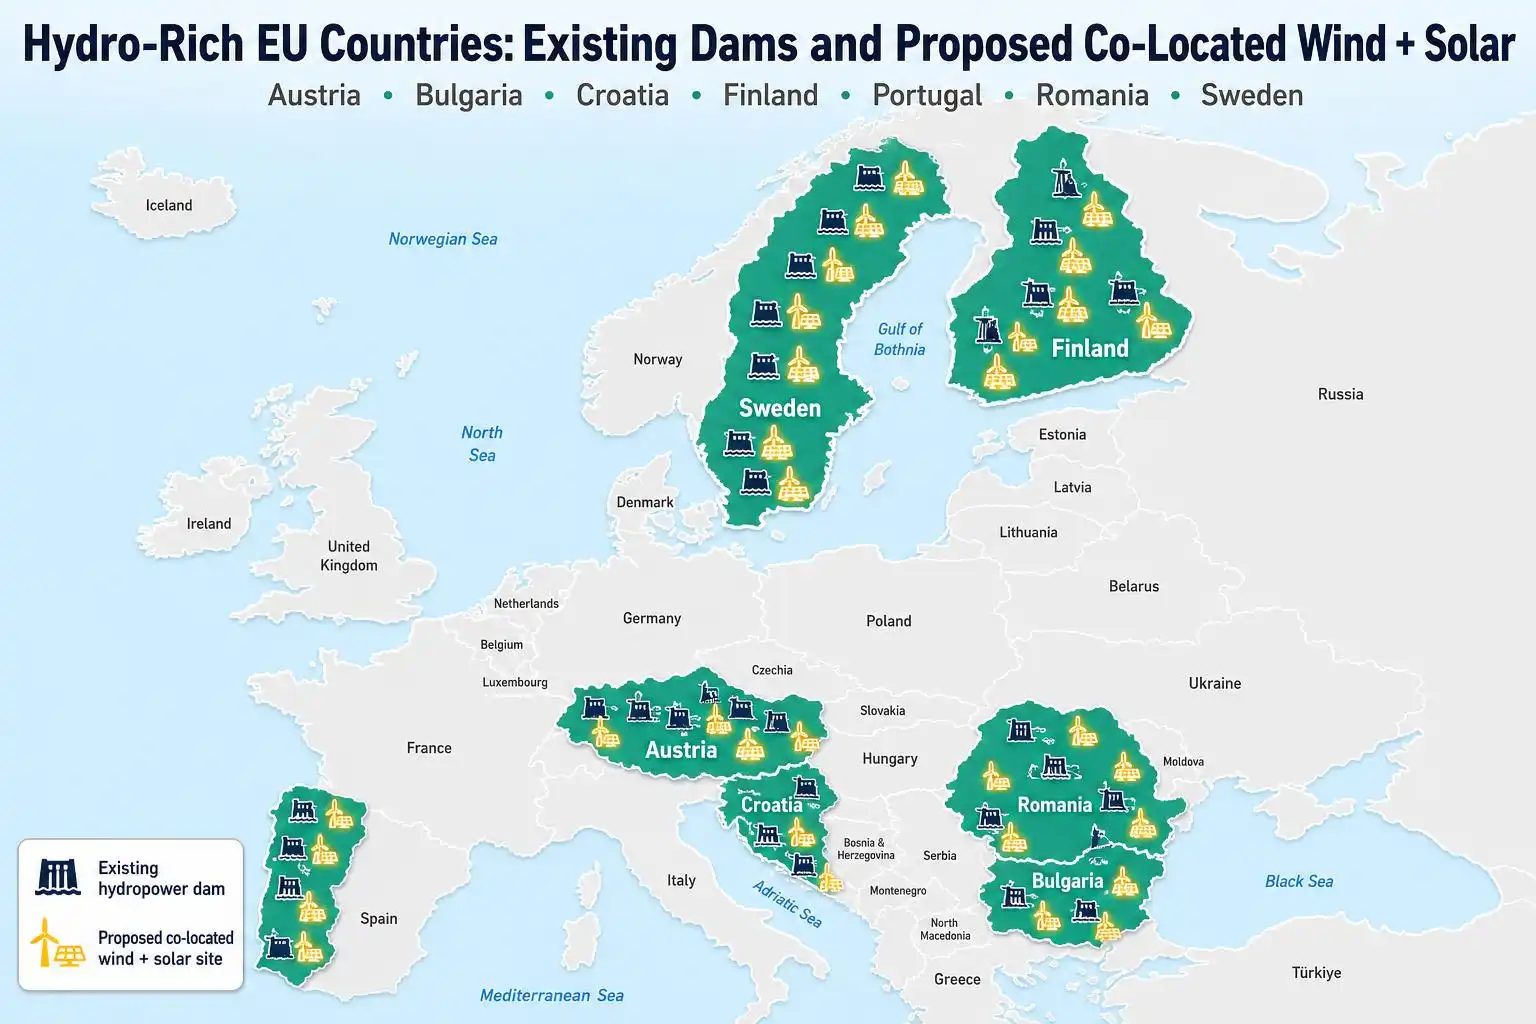
Meanwhile, Ember’s latest analysis offers one of the more practically useful findings to emerge from European grid research this year. Seven EU countries with large existing hydropower infrastructure — Austria, Bulgaria, France, Italy, Portugal, Romania, and Spain — could absorb an additional 25 GW of new wind and solar capacity without requiring new transmission grid buildout, by co-locating renewables with existing hydro assets and grid connection points.[1]
This matters because grid connection is one of the primary bottlenecks slowing European renewable deployment. These seven countries are collectively expecting to add around 138 GW of wind and solar between 2026 and 2030 — an increase of more than 50% on their existing 235 GW of wind and solar capacity.[1] That is a demanding build rate under any circumstances. Austria and Bulgaria, notably, currently have zero remaining transmission capacity for new connections — meaning that without creative solutions, new projects in those countries simply cannot connect.
The hydro co-location approach is not a silver bullet. Twenty-five gigawatts is a meaningful contribution to 138 GW, but it is not the whole answer. What it represents is a way to unlock near-term capacity without waiting for the years-long permitting and construction timelines that new transmission lines require. In a decade where every year of deployment delay has compounding consequences for emissions trajectories, that matters.
The Pattern Underneath All Three Stories
What connects a Texas peak load record, U.S. battery storage growth statistics, and a European hydro co-location analysis? In each case, the physical infrastructure layer — the wires, the connection points, the transmission corridors — is the binding constraint.
Storage is growing at 70% per year, but it still connects to grids that were designed for a different generation mix. ERCOT is managing record peaks on a grid that is structurally isolated. European countries with ambitious renewable targets are running into zero-capacity transmission networks. The technology deployment curves are genuinely impressive. The grid infrastructure curves are not keeping pace.
This is not a new observation, but the current data makes it unusually concrete. The question for the next five years is not whether wind, solar, and storage can be manufactured and financed at scale — the answer to that is increasingly yes. The question is whether the permitting systems, the grid operators, and the capital allocation frameworks can build the infrastructure that connects those assets to actual load.
Southeast Asia is navigating the same tension at a larger scale. The IEA’s 2026 Southeast Asia Energy Outlook projects total energy investment rising from roughly $100 billion in 2025 to close to $190 billion by 2035 under an accelerated policy scenario, with the largest increases required in grids, storage, and end-use electrification.[4] The investment numbers are large. The grid buildout requirement embedded within them is larger still.
The energy transition is not primarily a technology problem anymore. It is a construction and permitting and grid interconnection problem. The data from this month confirms it.
References
- Power on tap: EU hydro giants can add 25 GW renewables without new grids | Ember — https://ember-energy.org/latest-insights/power-on-tap-eu-hydro-giants-can-add-25-gw-renewables-without-new-grids
- Battery storage capacity averaged 70% growth over the last three years | EIA — https://www.eia.gov/todayinenergy/detail.php?id=67925
- Hourly peak load in ERCOT set a new record, exceeding 91 GW on July 22 | EIA — https://www.eia.gov/todayinenergy/detail.php?id=67906
- Southeast Asia’s energy challenges and emerging opportunities – Southeast Asia Energy Outlook 2026 | IEA — https://www.iea.org/reports/southeast-asia-energy-outlook-2026/southeast-asia-s-energy-challenges-and-emerging-opportunities



Leave a Reply