
The question I get asked most often after a major heat event is some version of: “Is this climate change?” My answer is always the same — it’s the wrong question. The right question is: “By how much did climate change make this more likely, and how much hotter did it make it?” This summer, the evidence arriving from across the Northern Hemisphere has made those answers unusually clear.
A Season of Records, Not Anomalies
Let’s start with the facts on the ground, because they are striking even before we apply any statistical framework.
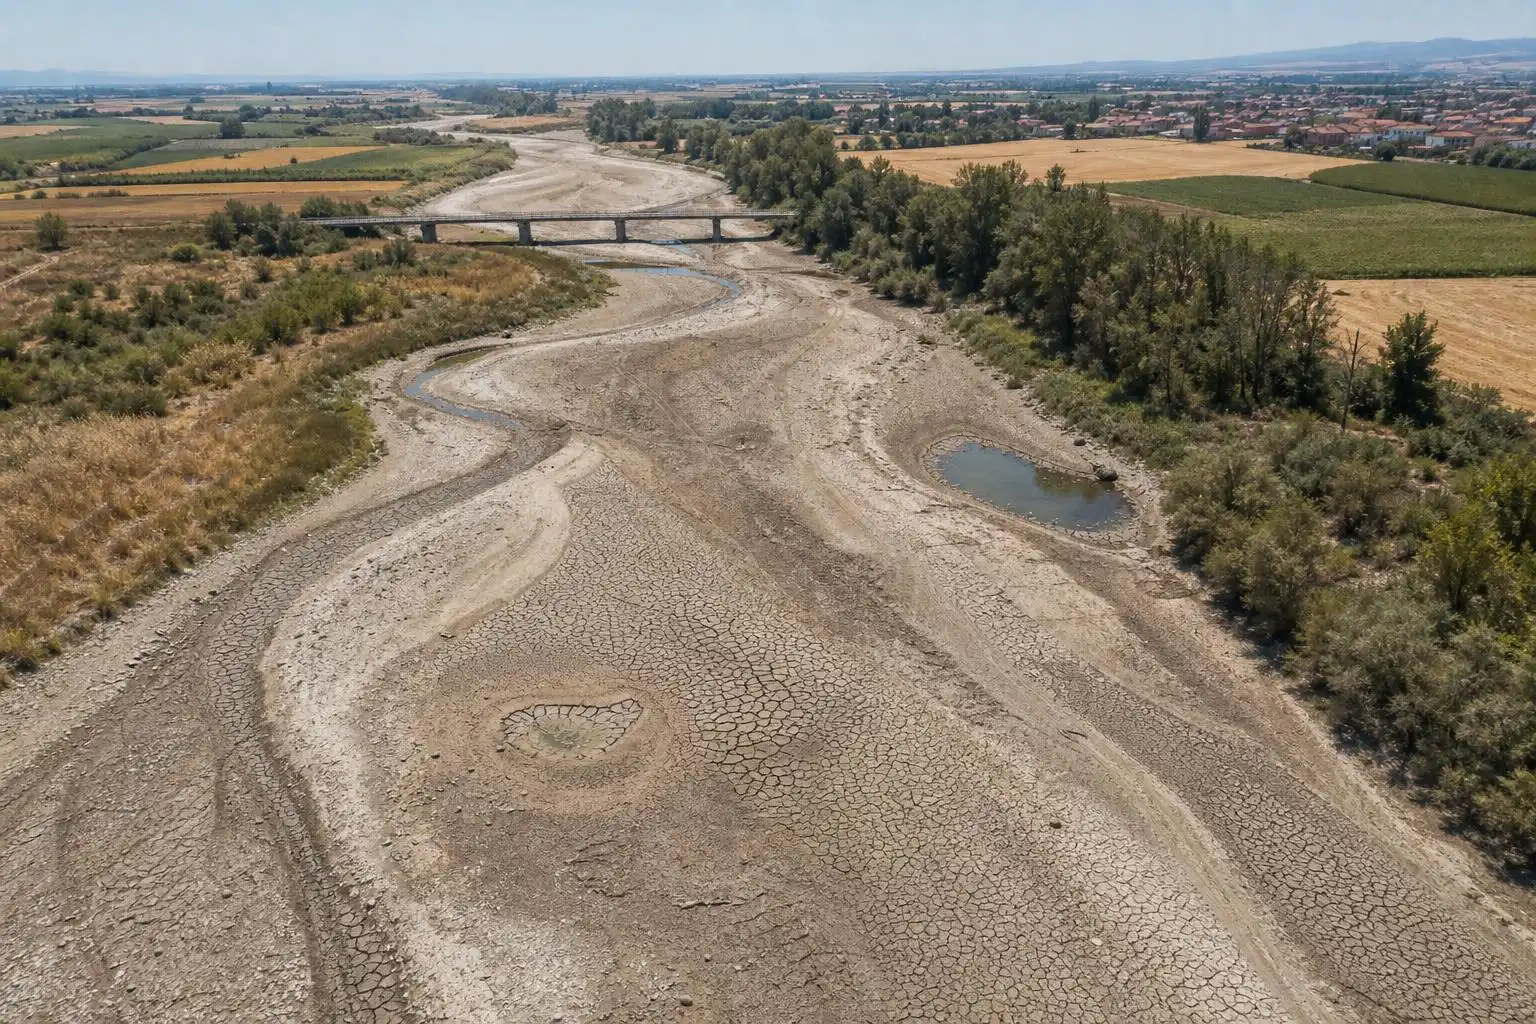
South Korea recorded its highest temperature in 122 years of weather observations, with Seoul forecast to hit 39°C during a peak that the country’s president described as demanding an “all-out response.” More than 20 deaths had already been attributed to the heat before the worst of it arrived.[1] In central Europe, Austria logged a new all-time temperature record while Hungary moved to curb electricity consumption as the grid buckled under air-conditioning demand, with Budapest approaching 40°C.[5] The Rhine — one of Europe’s most critical commercial arteries — fell to new low-water marks, halting cargo vessel traffic on southern sections and threatening German industrial supply chains.[8] Britain declared more than seventy percent of England to be in drought, experiencing its fifth heatwave of the year by mid-August.[6]
And then came the seasonal summary. The UK Met Office confirmed that Britain had just experienced its hottest summer since records began in 1884 — the second record-breaking summer in a row.[4]
That last detail — two consecutive record summers — is worth pausing on. It is not how natural variability typically behaves.
The 1-in-1,000-Year Number
The statistic that should stop every conversation in its tracks came from Mark McCarthy, the Met Office’s head of climate attribution. In a climate free from human-generated greenhouse gases, he said, the UK would experience a summer like 2026 roughly once in 1,000 years.[4]
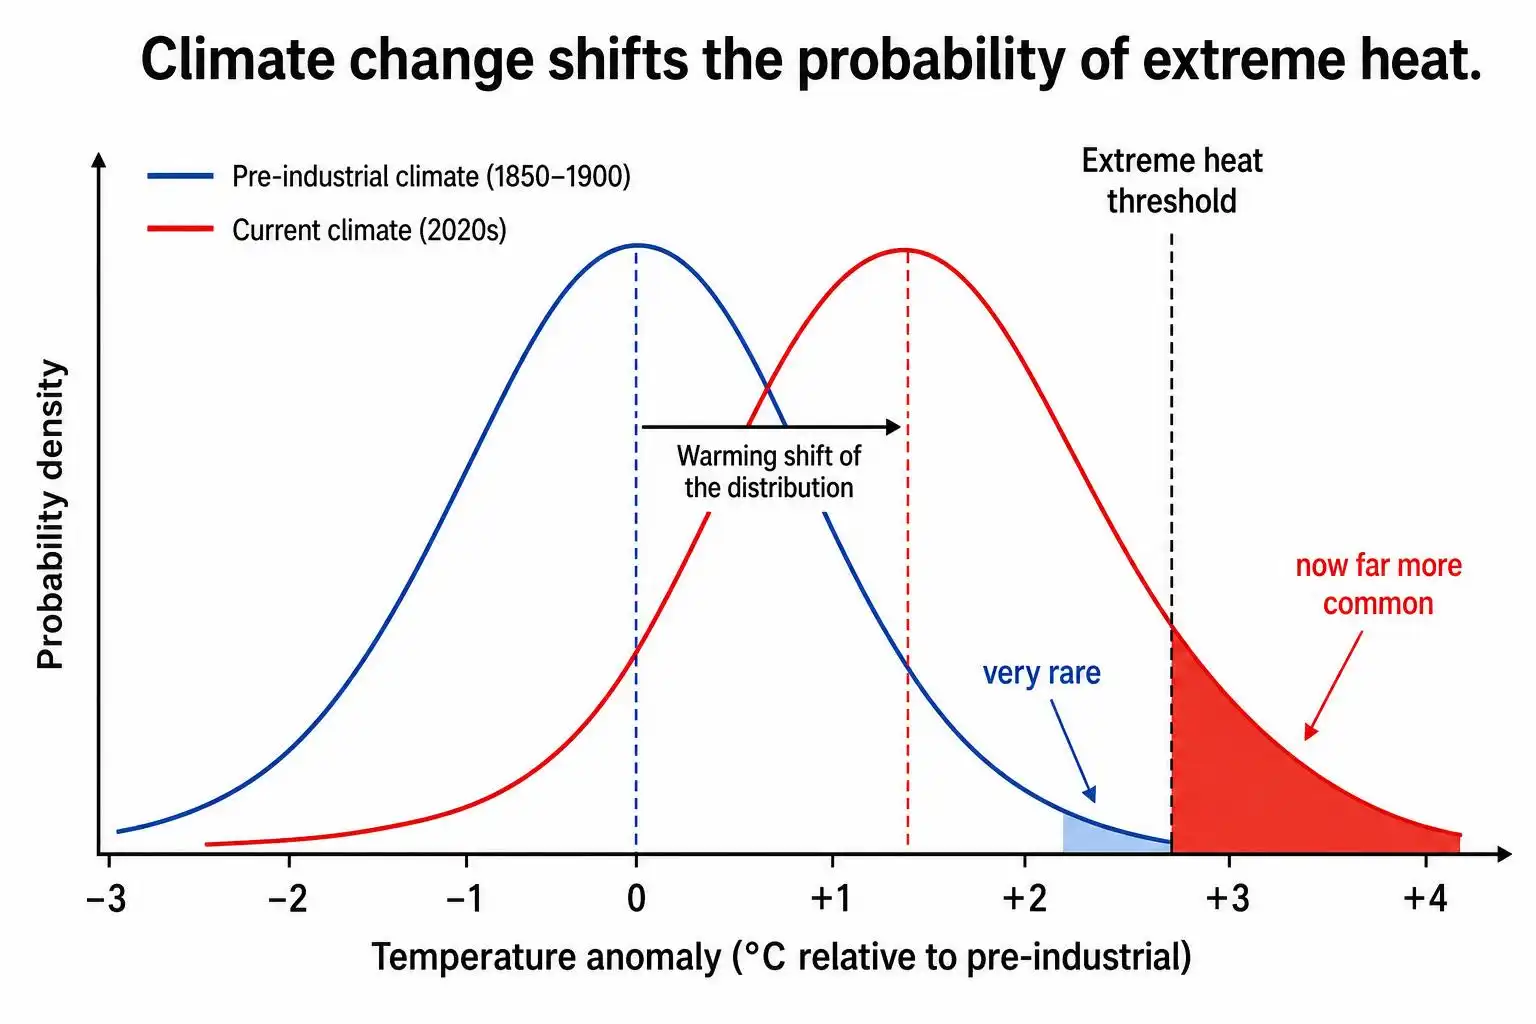
This is the language of return periods, and it is the core tool of attribution science. A 1-in-1,000-year event in a pre-industrial climate does not mean it happens once every millennium and then stops. It means it has a 0.1% probability of occurring in any given year under those baseline conditions. When we observe such an event in the world we actually inhabit — one that is roughly 1.2 to 1.3°C warmer than pre-industrial — we can use climate model ensembles to estimate how that probability has changed.
The mathematics here is not mysterious. Temperature distributions shift when you add energy to the atmosphere. The mean moves upward, but the tail — the extreme right-hand end of the distribution representing the hottest outcomes — moves disproportionately further. An event that was genuinely rare in a cooler world becomes far more frequent in a warmer one. A 1-in-1,000-year event under pre-industrial conditions might become a 1-in-50-year event at 1.2°C of warming, and a 1-in-10-year event at 2°C. The exact numbers vary by region and event type, but the directional logic is robust across virtually every major attribution study published in the last decade.
What McCarthy’s statement tells us is that this summer’s UK heat was not a statistical fluke sitting at the edge of natural variability. It was an event that essentially requires the warmer world we have built to occur with any regularity at all.
The Mortality Blind Spot
One of the most important — and most underappreciated — aspects of this summer’s events is not the temperature records themselves, but what they did to human bodies. The CEO of Swiss Re, one of the world’s largest reinsurance companies, stated publicly that authorities have systematically underestimated the risk to human life posed by heatwaves.[2]
This is not a fringe view. Epidemiological research consistently shows that heat mortality is dramatically undercounted in official figures. When a person dies of cardiac arrest during a heatwave, the death certificate typically reads “cardiac arrest,” not “heat.” Excess mortality analyses — comparing observed deaths during a heat period to statistically expected deaths based on historical baselines — routinely reveal that the true toll is two to five times higher than officially attributed figures.
The Swiss Re CEO’s comment carries particular weight because it comes from an institution whose entire business model depends on accurately pricing risk. When reinsurers say risk is underestimated, it is not advocacy — it is actuarial concern. And it aligns with a broader pattern: the hidden populations most vulnerable to heat, including elderly people living alone, outdoor workers, and incarcerated individuals. This summer, journalists documented a crisis unfolding inside Europe’s prisons, where overcrowded, poorly ventilated cells turned into heat traps, with inmates in France reporting loss of consciousness and serious injuries from heat-related falls.[7] These are people with no ability to seek cooler environments, and they rarely appear in the headline death counts.
The 1.5°C Threshold Is No Longer a Future Scenario
Overlaying all of this is a sobering assessment from the United Nations Environment Programme, which stated in early September that global temperature rises are set to exceed 1.5°C “within a few years.”[3]
I want to be precise about what this means, because the 1.5°C figure is often misunderstood. The Paris Agreement target refers to long-term average global surface temperature relative to the pre-industrial baseline, typically defined as 1850–1900. Individual years have already exceeded 1.5°C above that baseline. What UNEP is now saying is that the long-term average — the smoothed trend that filters out year-to-year variability — is approaching that threshold. Once the long-term average crosses 1.5°C, individual heat events will be occurring in a world that is structurally hotter than the Paris guardrail, not just episodically warmer.
For attribution science, this matters enormously. The shift in return periods I described above — from 1-in-1,000 to 1-in-50 — was calculated for roughly 1.2°C of warming. At 1.5°C, those return periods compress further. Events that are rare today become routine. Events that are currently extreme become the new normal against which future extremes are measured.
What “Attribution” Actually Means — and Doesn’t
I am aware that some readers will bristle at the word “attribution.” It sounds like blame, and blame in climate science is politically charged. So let me be clear about what attribution science does and does not claim.
It does not claim that climate change “caused” any individual heatwave. Heatwaves occurred before industrialization. Natural variability — driven by jet stream dynamics, sea surface temperatures, soil moisture feedbacks, and other factors — still plays a role in every event.
What attribution science does is compare two worlds: the world as it is, with roughly 1.2–1.3°C of anthropogenic warming baked in, and a counterfactual world modeled without human greenhouse gas emissions. By running large ensembles of climate models under both conditions and examining how often events of a given magnitude occur in each, we can produce probabilistic statements. The 1-in-1,000-year figure from the Met Office is exactly this kind of statement. It is not a guess or an opinion. It is a model-derived probability ratio with quantifiable uncertainty bounds.
The honest scientific position is neither “climate change caused this heatwave” nor “you can’t attribute any single event to climate change.” Both of those framings are outdated. The correct framing is: “Climate change made this event approximately X times more likely and Y degrees hotter than it would otherwise have been.” For the summer of 2026, across multiple regions and multiple events, X is very large.
A Shifting Baseline for What We Call “Extreme”
Perhaps the most important takeaway from this summer is one that resists easy quantification: our intuitive sense of what counts as extreme is already lagging behind the physical reality.
When the UK has its hottest summer on record for the second consecutive year, the word “record” starts to lose its power to shock. When Rhine shipping halts become an annual news story rather than a once-in-a-generation disruption, industries begin to adapt — but adaptation takes time, investment, and political will that is rarely mobilized until the losses become undeniable.
The summer of 2026 has provided a great deal of undeniable evidence. The question attribution science cannot answer — but that societies urgently need to answer — is how much of that evidence is required before the response matches the scale of the shift already underway.
References
- South Korea’s president orders all-out response to heatwave — Reuters — https://www.reuters.com/business/environment/south-koreas-president-orders-all-out-response-heatwave-2026-08-06/
- Risk of deaths linked to heatwaves underestimated, Swiss Re CEO says — Reuters — https://www.reuters.com/legal/litigation/risk-deaths-linked-heatwaves-underestimated-swiss-re-ceo-says-2026-08-09/
- Global temperature rises to exceed 1.5 Celsius ‘within a few years’, UNEP says — Reuters — https://www.reuters.com/sustainability/cop/global-temperature-rises-exceed-15-celsius-within-few-years-unep-says-2026-09-02/
- UK summer was hottest on record, Met Office says, after severe heat, drought — Reuters — https://www.reuters.com/business/environment/uk-summer-was-hottest-record-met-office-says-after-severe-heat-drought-2026-09-01/
- Austria hits record temperature, Hungary curbs power use as Europe feels the heat — Reuters — https://www.reuters.com/business/environment/albanian-firefighters-battle-blazes-southern-eastern-europe-feels-heat-2026-08-05/
- UK PM to chair emergency meeting on heatwaves, drought — Reuters — https://www.reuters.com/business/environment/uk-pm-chair-emergency-meeting-heatwaves-drought-2026-08-12/
- Heatwaves expose overcrowding crisis in Europe’s ageing prisons — Reuters — https://www.reuters.com/world/europe/heatwaves-expose-overcrowding-crisis-europes-ageing-prisons-2026-08-07/
- Rhine water levels fall to new lows, some ship sailings halted — Reuters — https://www.reuters.com/business/environment/rhine-water-levels-fall-new-lows-some-ship-sailings-halted-2026-08-11/



Leave a Reply