
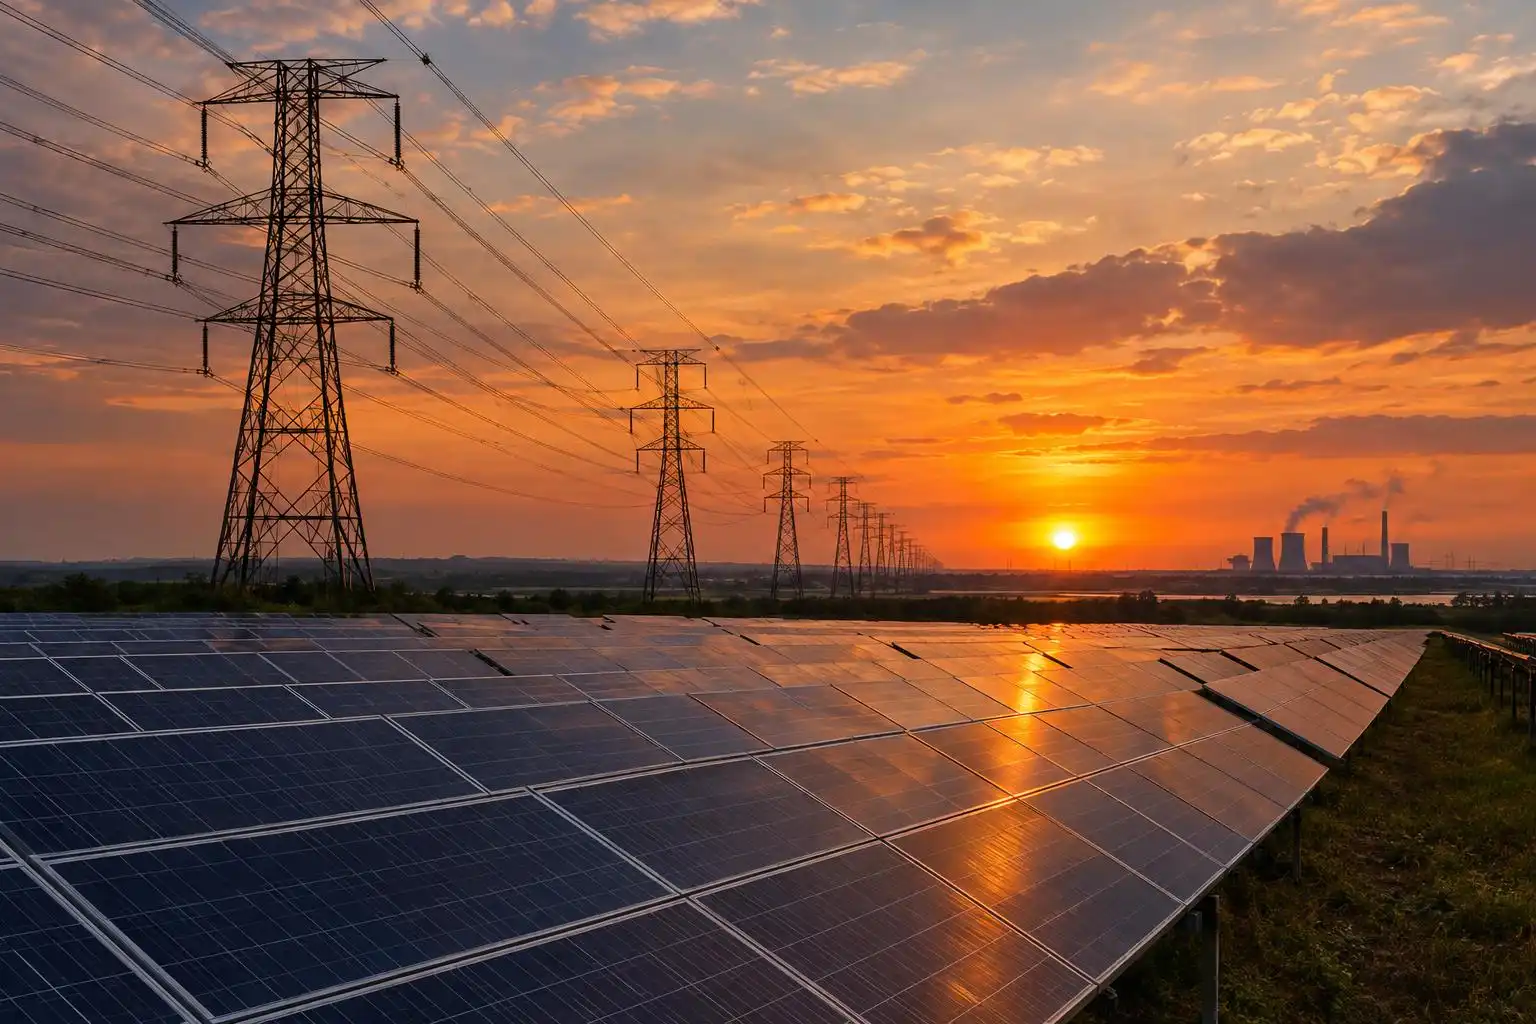

A new solar farm can be counted on the day it connects. Its effect on fossil-fuel generation is harder to count. That depends on when it produces, what demand looks like at that hour, and what other generators do in response. As electricity systems add renewables, the most useful question is shifting from how much capacity was built? to what happened when that capacity ran?
Start with the clock, then widen the lens
The U.S. Energy Information Administration’s regional operating-grid dashboards offer daily generation-mix views for California, Texas and the Carolinas. They provide a way to examine how the sources of electricity change over the course of a day, rather than treating a region’s annual mix as though it were constant.[3][4][2]

That comparison is useful precisely because the regions are not interchangeable. A generation-mix chart can show whether output from one source rose while another fell during a particular period. It cannot, by itself, prove that the first change caused the second. Demand, weather, plant outages and electricity moving across regional boundaries can all affect the result. One interesting day is a prompt to investigate, not a verdict on a technology.
Annual statistics answer a different question. The International Energy Agency’s Energy Statistics Data Browser covers 16 energy topics across more than 170 countries and regions, making it a resource for examining longer-run energy balances and trends.[1] The daily and annual views belong together: the first exposes operating patterns; the second helps establish whether those patterns are adding up to a durable change.
Capacity is a promise; generation is a result
Installed capacity tells us how much a plant could produce under specified conditions. Generation tells us how much electricity it actually supplied. Neither figure alone tells us how much fossil generation was avoided. A solar project may produce strongly at midday, for example, while a system’s hardest-to-serve hours arrive later. Adding more solar still adds useful electricity, but the timing determines how much other equipment the system needs alongside it.
The accounting also changes with the question being asked. A region can increase renewable generation in absolute terms while fossil generation rises too, if electricity demand grows faster. Its renewable share could then fall despite real construction progress. Conversely, a rising clean-energy share during a low-demand period does not establish that the same system can meet a high-demand evening. Reporting both quantities and shares—and specifying the period measured—avoids a great deal of false certainty.
This is why an operating dashboard is best read as a diagnostic, not a scoreboard. Look at repeated daily shapes, then check the monthly or annual totals before claiming a shift in emissions. Most importantly, do not treat a chart of generation sources as a direct measurement of carbon dioxide: emissions depend on which fossil plants ran, their fuel use and how efficiently they operated.
The grid determines how much new supply is usable
Türkiye’s 2026 energy-policy review from the IEA puts this operating problem in concrete terms. It warns that connection queues and congestion can delay solar and wind projects or make investment less certain. It recommends using existing grid infrastructure more efficiently as variable renewable generation, distributed resources and electrification grow.[5]
A project can be financially committed and physically built yet still wait to connect. Once connected, its output may be less valuable if the network cannot move electricity to where it is needed. Those are different constraints, and they call for different evidence. A count of announced megawatts does not reveal connection delays; a count of connected megawatts does not reveal congestion during operating hours.
The same IEA review describes nuclear power as part of Türkiye’s intended future low-carbon electricity system. It discusses the Akkuyu plant and plans for two additional nuclear plants, alongside the expected expansion of wind and solar.[5] Those plans should be reported as plans. Their contribution to electricity supply can be measured only as projects are completed and begin generating.
What to watch as the build-out continues
A practical transition check needs several measures, each tied to a distinct claim:
- Connected capacity: What entered service, rather than merely entering a development queue?
- Actual generation: How much electricity did new and existing sources deliver across seasons and demand conditions?
- System constraints: Did connection delays or congestion limit what projects could supply?
- Fossil output and emissions: Did fossil generation and its associated carbon dioxide fall in absolute terms?
The measures do not always move together in a single quarter. That is not an excuse to dismiss deployment, or to declare victory on the strength of one chart. It is a reason to follow projects past the announcement, watch how the grid operates after they connect, and check whether the annual totals confirm the direction suggested by the daily data. The transition becomes real in those operating results.
References
- Energy Statistics Data Browser — IEA — https://www.iea.org/data-and-statistics/data-tools/energy-statistics-data-browser
- Real-time Operating Grid: Carolinas Daily Generation Mix — EIA — https://www.eia.gov/electricity/gridmonitor/dashboard/daily_generation_mix/regional/REG-CAR
- Real-time Operating Grid: California Daily Generation Mix — EIA — https://www.eia.gov/electricity/gridmonitor/dashboard/daily_generation_mix/regional/REG-CAL
- Real-time Operating Grid: Texas Daily Generation Mix — EIA — https://www.eia.gov/electricity/gridmonitor/dashboard/daily_generation_mix/regional/REG-TEX
- Policy Recommendations: Türkiye 2026 — IEA — https://www.iea.org/reports/turkiye-2026/policy-recommendations


Leave a Reply
You must be logged in to post a comment.